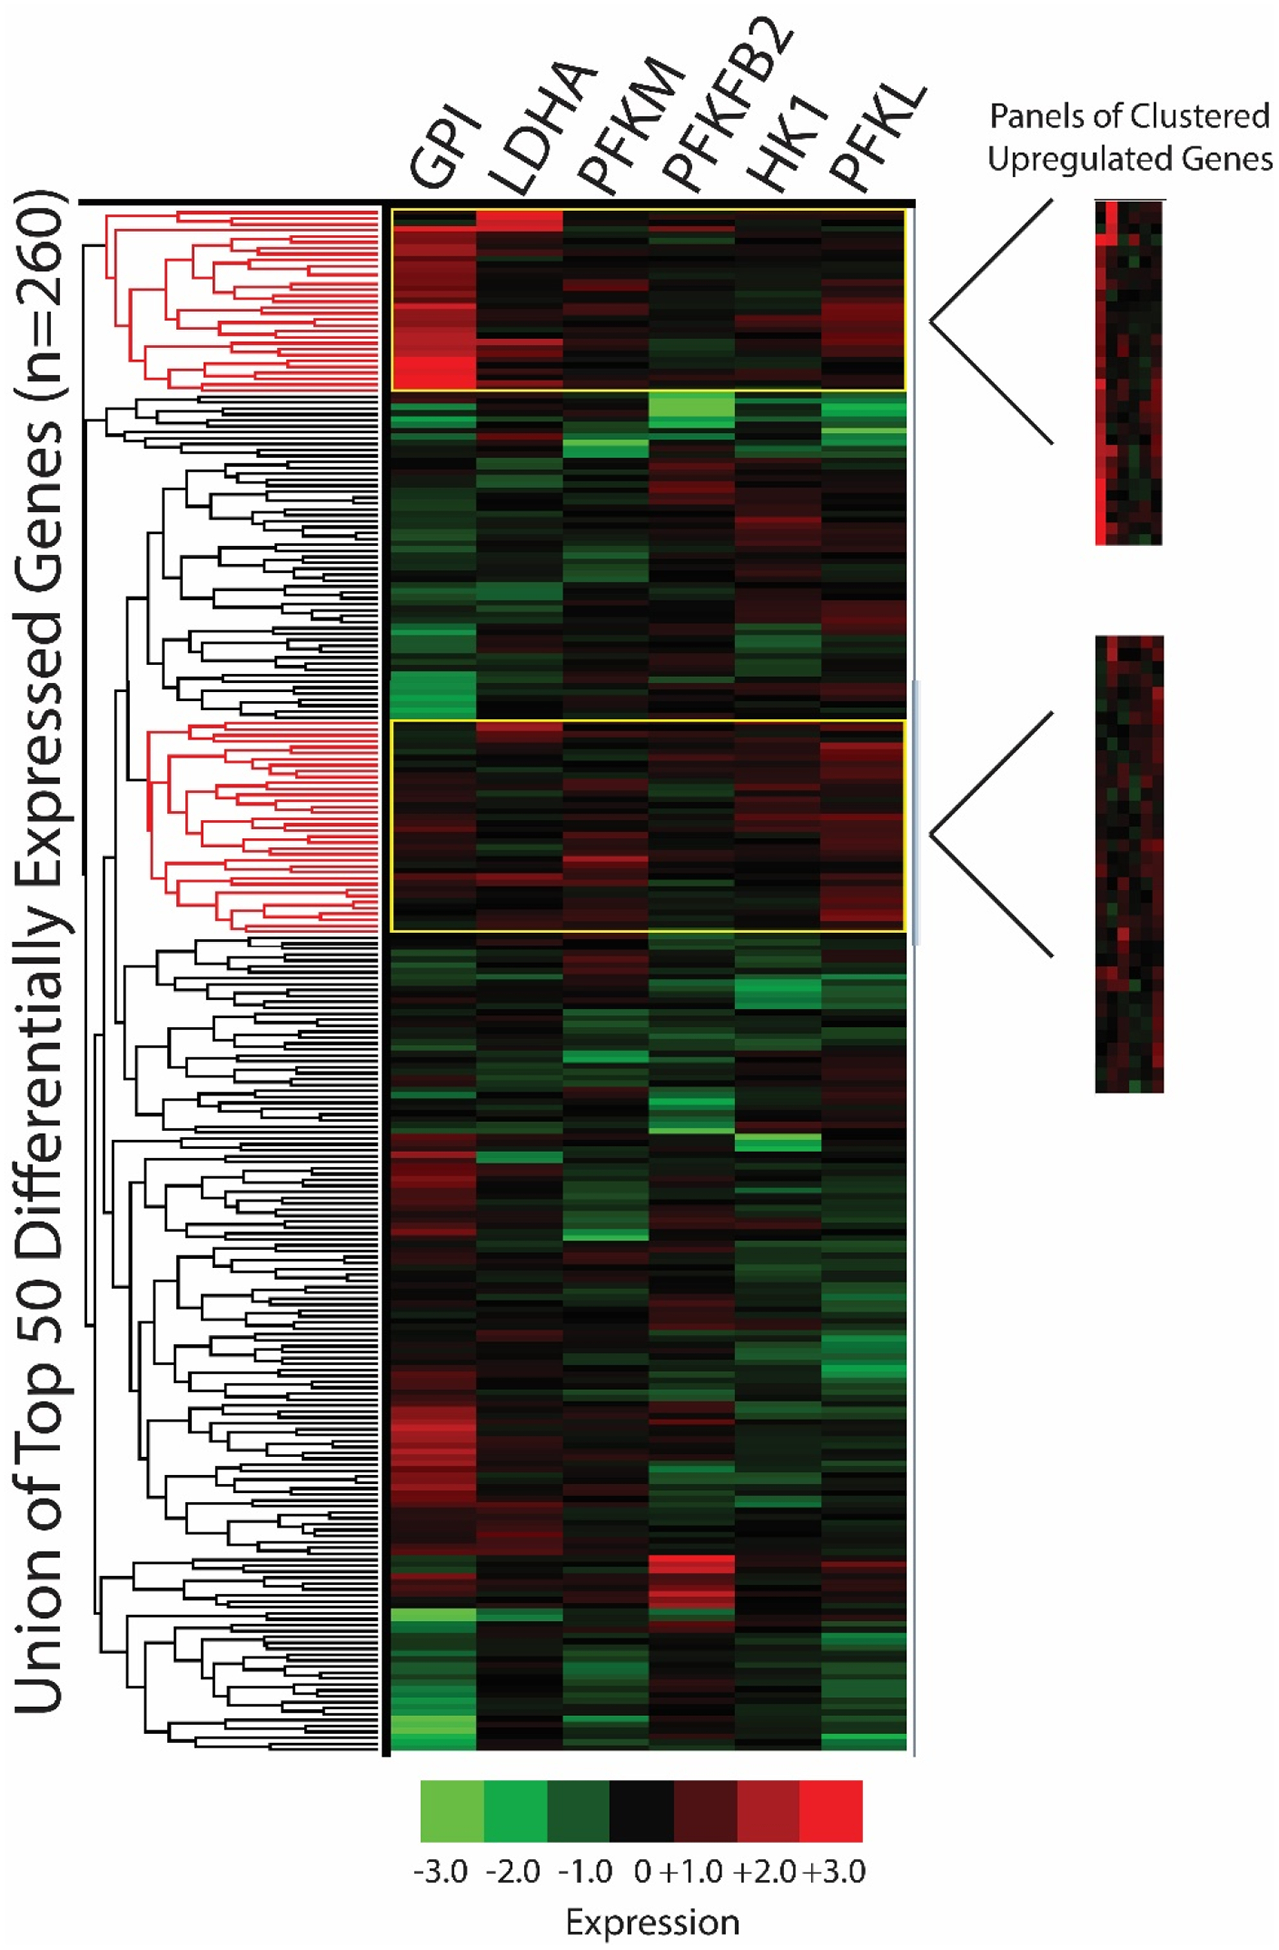
Figure 3. Clustering analyses: panels of clustered upregulated genes.

The union of the top 50 differentially expressed L1000 genes per seed gene knockdown signature were clustered in iLINCS via Pearson correlation coefficients (n=260 genes due to gene overlap). Panels of upregulated gene clusters were selected using the dendrogram clustering function and fold change/p-values were exported to Excel. Phosphofructokinase liver type (PFKL); PFK muscle type (PFKM); G lucose-6-phosphate isomerase (GPI); 6-phosphofructo-2-kinase (PFKFB2); lactate dehydrogenase A (LDHA); hexokinase 1 (HK1).
