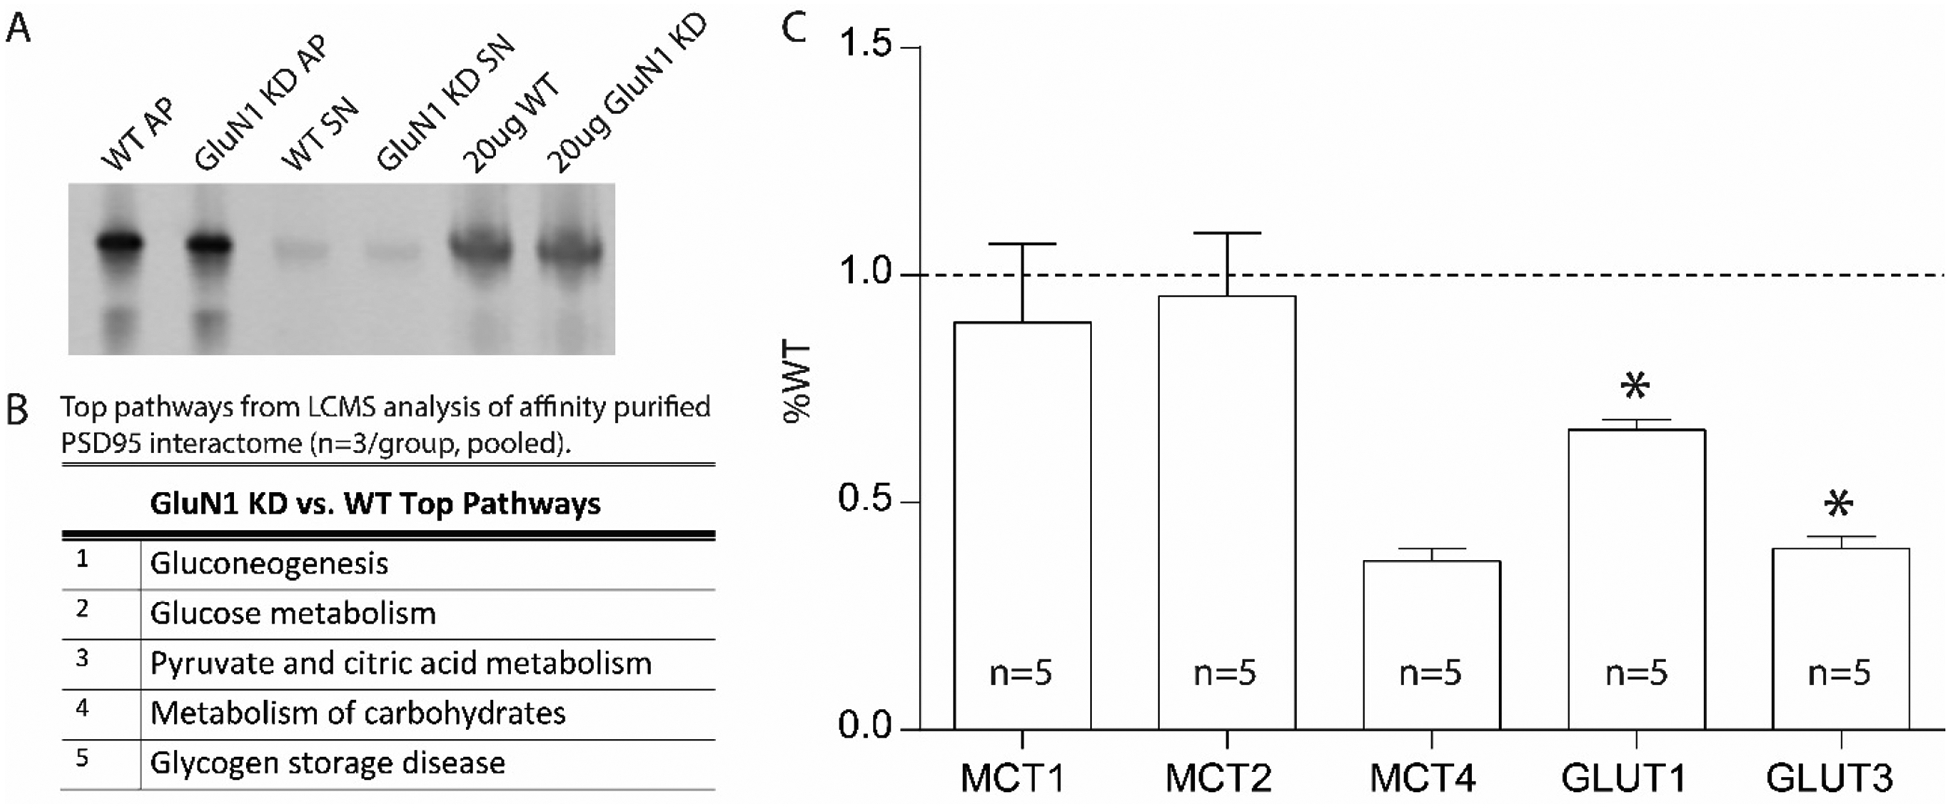
Figure 5. Metabolic defects in the GluN1 knockdown mouse model.

Representative PSD-95 Affinity Purification of WT and GluN1 KD mouse samples (A). Enrichr pathway analysis of the top 20 interacting proteins for postsynaptic density 95 (PSD95) interactome for GluN1 KD versus WT mice (n=3/group, pooled) (B). Metabolic transporter transcripts in frontal cortex of GluN1 KD mice expressed as percent wildtype (WT) (n=5) (C). Wildtype (WT); affinity purification (AP); knockdown (KD); supernatant (SN); liquid chromatography-tandem mass spectrometry (LCMS); monocarboxylate transporter (MCT); Glucose transporter (GLUT); Wildtype (WT). Data are expressed as percent control ± SEM. *P<0.05.
