
Figure 8. Prepulse inhibition and acoustic startle response.
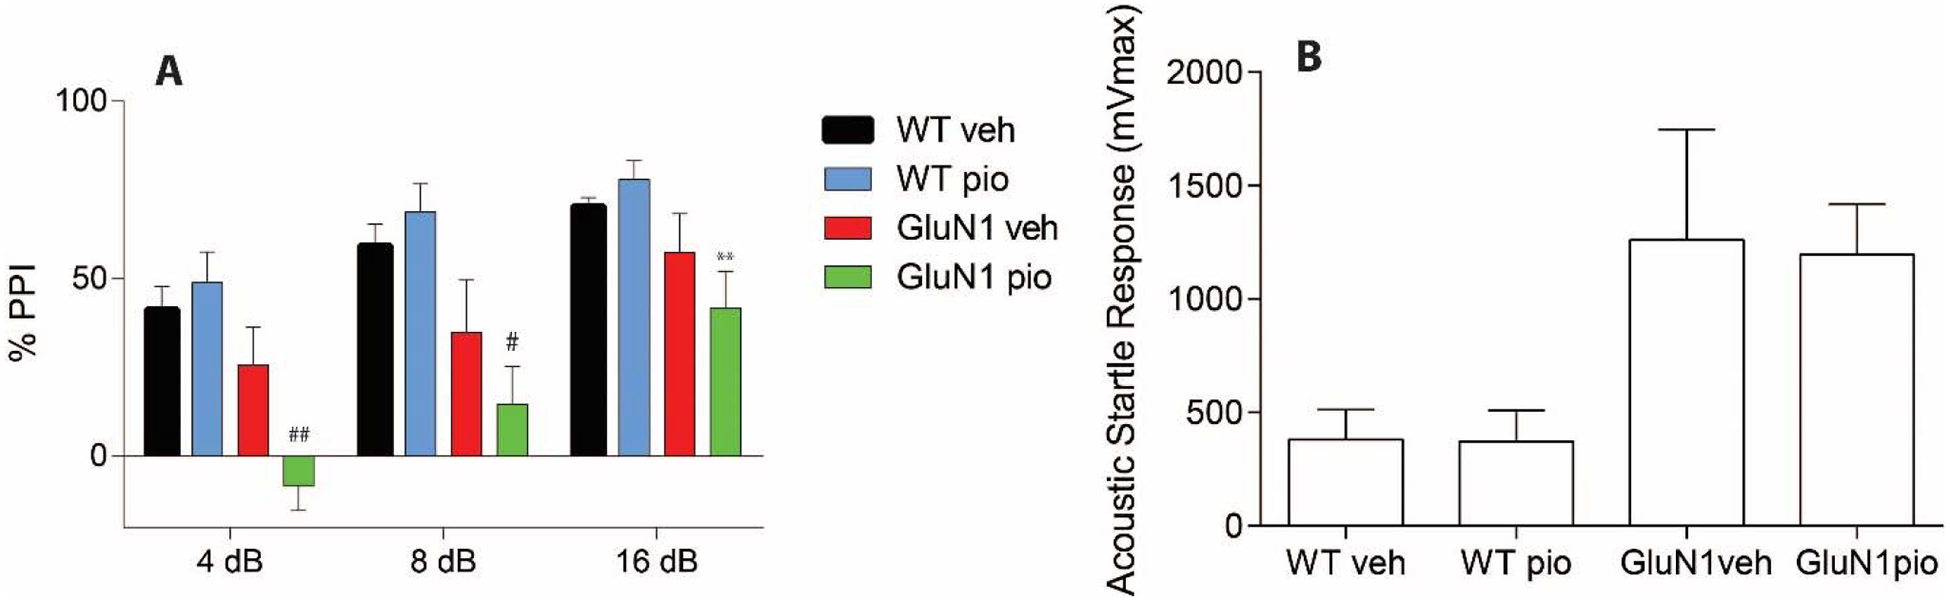
Sensorimotor gating (pre-pulse inhibition) represented as percent inhibition of acoustic startle response at three pre-pulse tones; 4db, 8db, and 16dB (A). Acoustic startle response to 165dB startle pulse in pre-pulse inhibition test (B). * denotes significantly different from WTveh; ** denotes significantly different from WTpio; # denotes significantly different from WTveh and WTpio; ## denotes significantly different from WTveh, WTpio, and GluN1veh. Data shown as mean ± SEM. P<0.05.