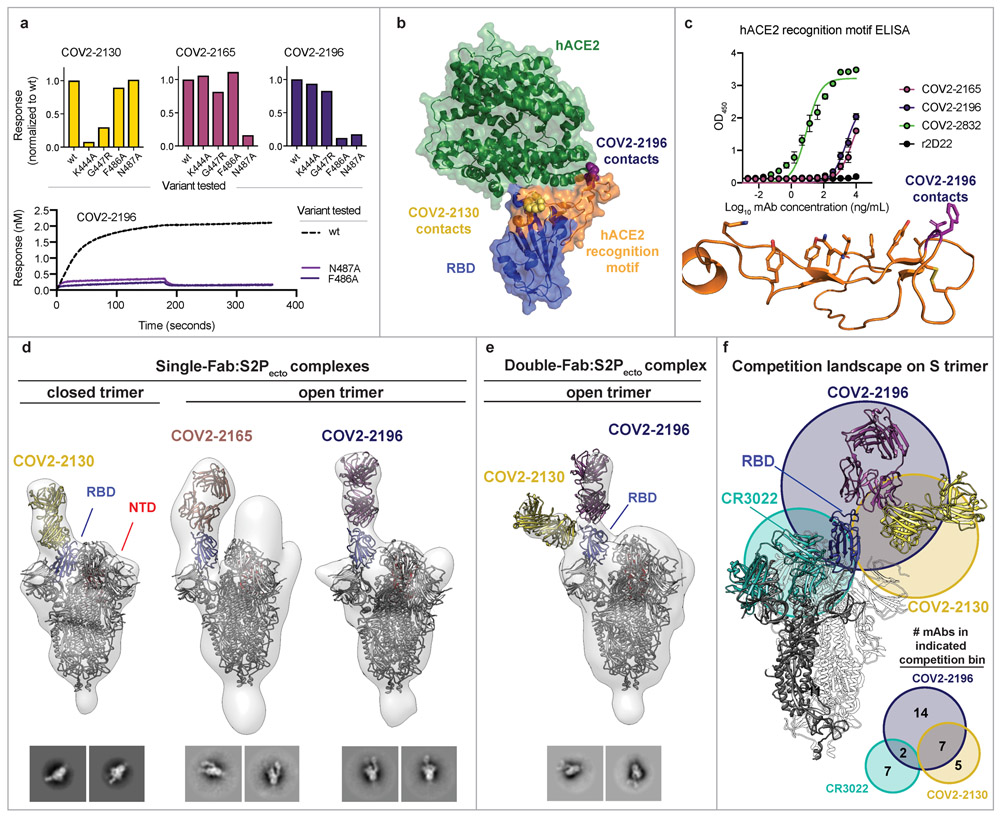
Figure 3. Epitope identification and structural characterization of mAbs.
a. Identification of critical contact residues by alanine and arginine mutagenesis. Top: binding of COV2-2130 (gold), COV2-2165 (maroon) or COV2-2196 (dark purple) to wild-type (wt) or mutant SRBD constructs normalized to wt. Bottom: representative binding curves for COV2-2196 to wt or SRBD constructs with mutated critical contact residues.
b. Co-crystal structure of SARS-CoV-2 RBD (blue) and hACE2 (green) (PDB 6M0J). The hACE2 recognition motif is colored orange. Critical contact residues are shown for COV2-2130 (gold spheres) and COV2-2196 (purple spheres).
c. ELISA binding of mAbs to the hACE2 recognition motif. r2D22 is shown as a negative control. Mean ± SD of technical triplicates are shown from a single experiment repeated twice. Bottom: structure of hACE2 recognition motif in orange with COV2-2196 critical contact residues shown in purple.
d. Single-Fab:S2Pecto trimer complexes visualized by negative-stain electron microscopy for COV2-2130 (gold), COV2-2165 (maroon), or COV2-2196 (dark purple). The RBD is shown in blue and the S N-terminal domain (NTD) is shown in red. Electron density is shown in grey. Trimer state (open or closed) is denoted for each complex. Representative 2D class averages for each complex are shown at the bottom (box size is 128 pixels, with 3.06 Å/pixel). Data were collected in a single experiment with detailed collection statistics in Supplemental Table 2.
e. COV2-2130 and COV2-2196 Fabs in complex with S2Pecto trimer. Colors and data collection are as in (d). Representative 2D class averages for the complexes are shown at the bottom with scales as in (d).
f. Competition-binding analysis visualized on S2Pecto trimer. The CR3022 crystal structure was docked into the double-Fab:S2Pecto trimer model. CR3022 is shown in cyan. Bottom: a quantitative Venn diagram notes the number of mAbs in each competition group.

