. 2020 Sep 21;9:e60474. doi: 10.7554/eLife.60474

Figure 5. Genomic patterns of Ty insertions indicate that natural selection efficiency cannot explain CN variation in natural lineages.

(a) Difference between growth curves in 0.8 mM NaAsO2 (As) and control medium (synthetic complete, SC). Curves depict the difference in culture optical density (OD) through time, averaged across replicates and bins of four timepoints (one hour). 123 strains were assayed. SpC strain LL2011_004, which harbors a Ty1 insertion in ARR3, is represented by a dashed line. (b) Area under the curve (AUC) of the difference between growth curves in As and SC. Replicates of 107 strains that passed the criteria of number of replicates and homoscedasticity are shown. The number of strains per lineage is shown between parentheses. Replicates of the SpC strain LL2011_004 are highlighted with large empty circle symbols. Lowercase letters indicate groups that are not significantly different following Tukey’s HSD test. (c) Counts of essential and non-essential genes in the immediate vicinity of Ty insertions across the six whole-genome assemblies. Essential to non-essential ratios are shown on top of the bars. (d-e) Cumulative distributions of number of protein physical interactions (d) and ω (e) for genes neighboring conserved (dashed line) or private (solid lines) Ty insertions. Genes containing ORF-disrupting insertions are labeled with symbols. Heatmaps show FDR-corrected p-values for pairwise Mann-Whitney U tests between distributions. Color maps are centered at the significance threshold of 0.05. (f) Cumulative distributions of Δk between SpB and SpC. (g) Counts of neighboring genes with positive or negative Δk values.

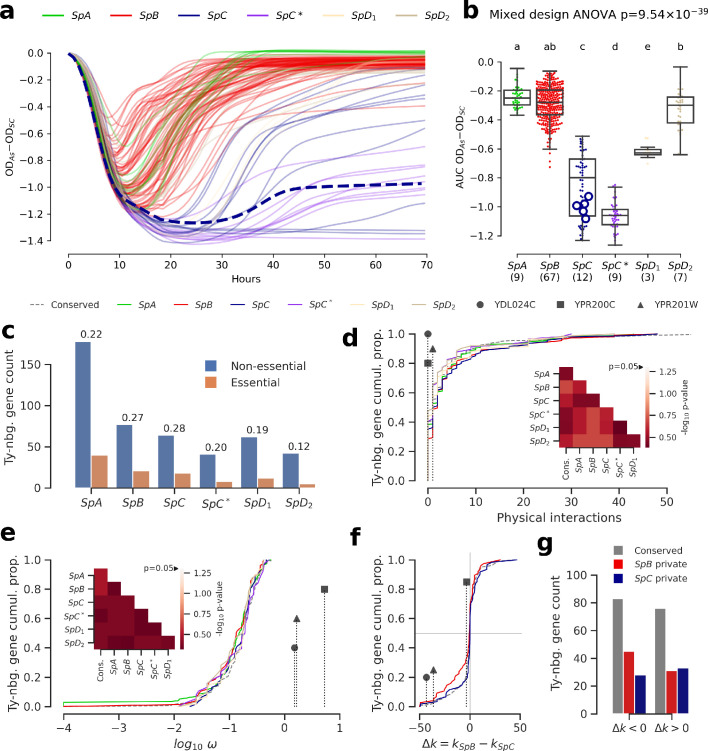
Figure 5—source data 1. Growth data in SC and As for wild S. paradoxus strains.
Figure 5—source data 2. Properties of genes neighboring Ty insertions in the six whole-genome assemblies.

Figure 5.

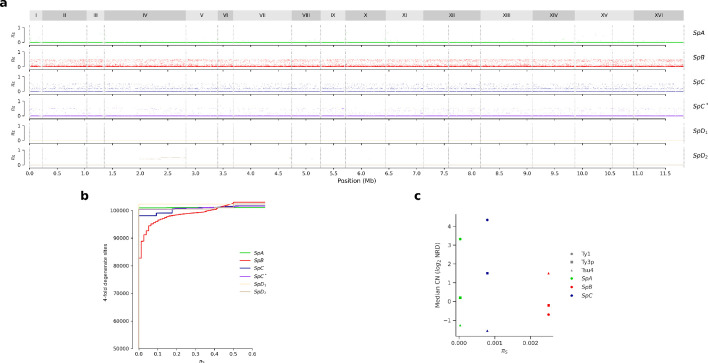
Figure 5—figure supplement 1. Synonymous diversity at fourfold degenerate codon positions (πS).

Figure 5—figure supplement 1.

(a) Genome-wide πS. (b) Cumulative distributions of πS. (c) Median Ty CN per lineage as a function of πS.
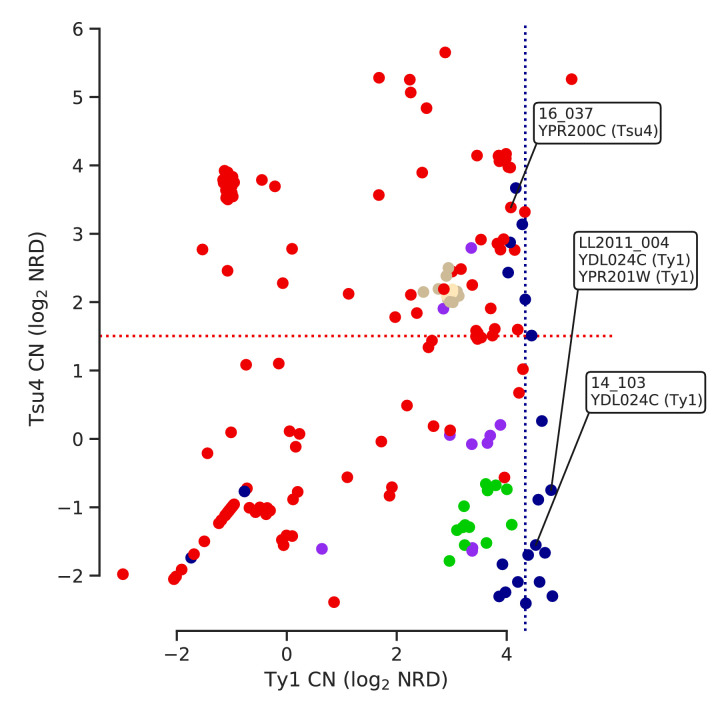
Figure 5—figure supplement 2. Ty copy numbers (CNs) of strains harboring ORF-disrupting insertions in relation with lineage-wide distributions of CN.

Figure 5—figure supplement 2.

Strains with ORF-disrupting insertions are labelled with the corresponding gene and Ty family. Median Ty1 CN for SpC and median Tsu4 CN for SpB are shown as dotted lines.
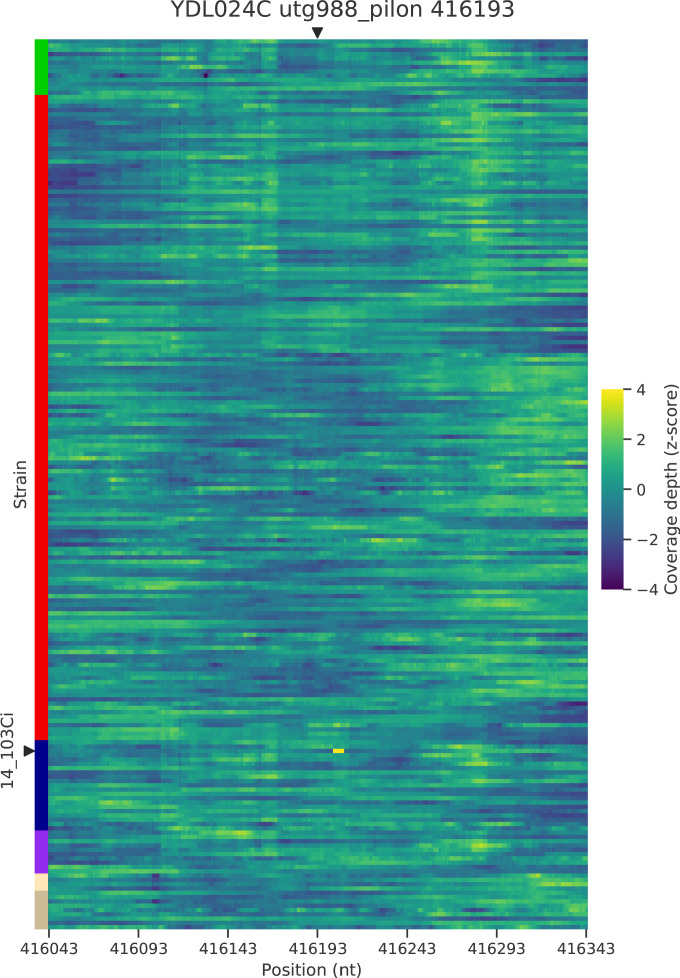
Figure 5—figure supplement 3. Normalized depth of coverage at locus YDL024C-416.2 predicted to harbor Ty insertions.

Figure 5—figure supplement 3.

Rows correspond to the 207 wild strains. Strains with predicted insertions are labelled on the y axes. Positions on the x axes correspond to 300 bp windows centered at the predicted locus.
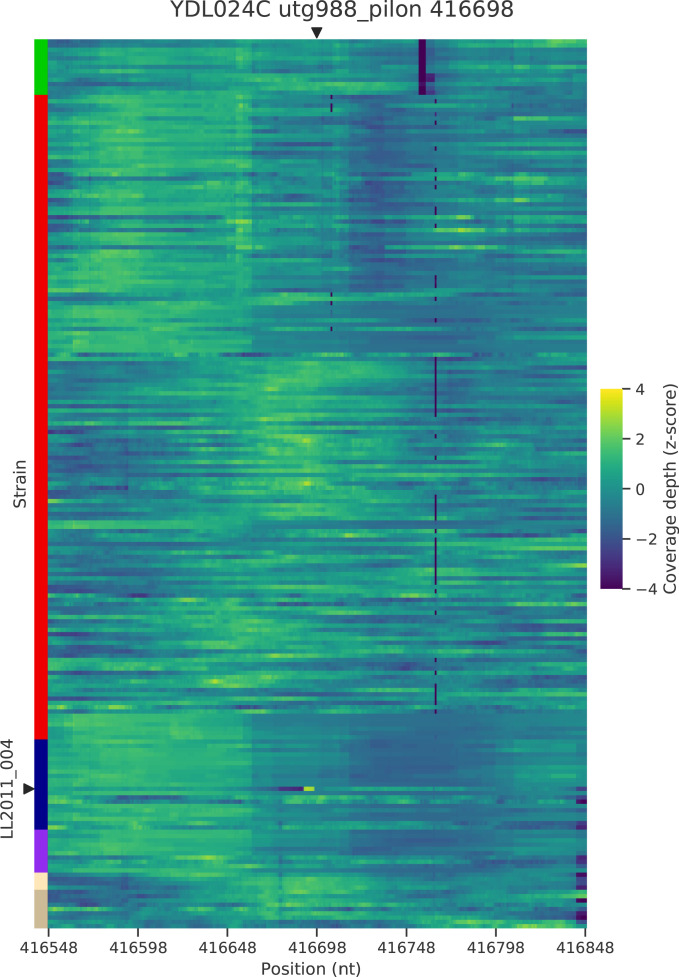
Figure 5—figure supplement 4. Normalized depth of coverage at locus YDL024C-416.7 predicted to harbor Ty insertions.

Figure 5—figure supplement 4.

Rows correspond to the 207 wild strains. Strains with predicted insertions are labelled on the y axes. Positions on the x axes correspond to 300 bp windows centered at the predicted locus.
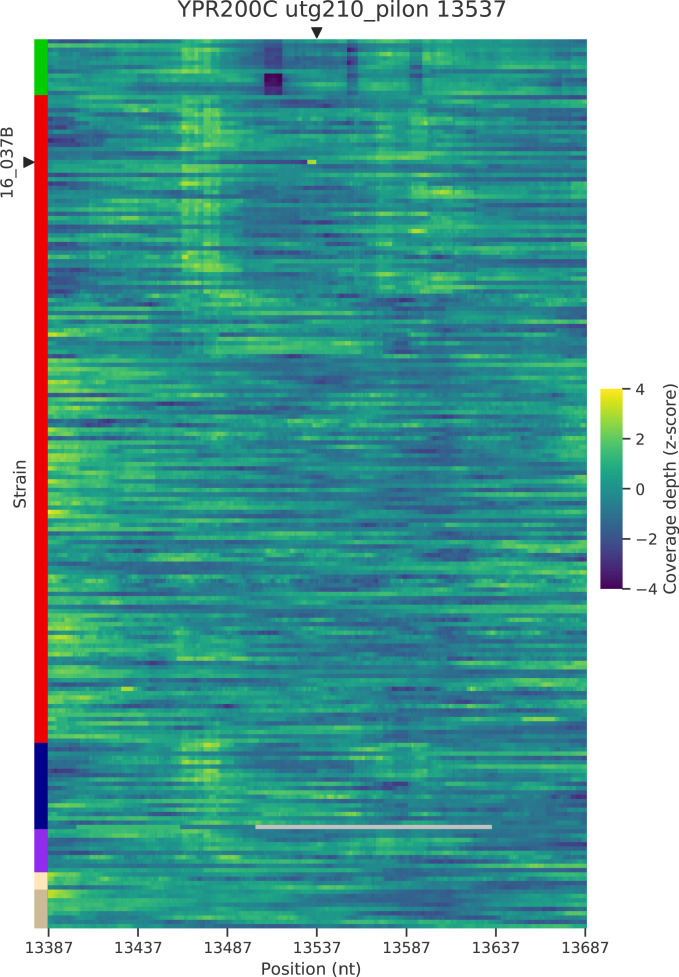
Figure 5—figure supplement 5. Normalized depth of coverage at locus YPR200C predicted to harbor Ty insertions.

Figure 5—figure supplement 5.

Rows correspond to the 205 wild strains. Strains with predicted insertions are labelled on the y axes. Positions on the x axes correspond to 300 bp windows centered at the predicted locus.
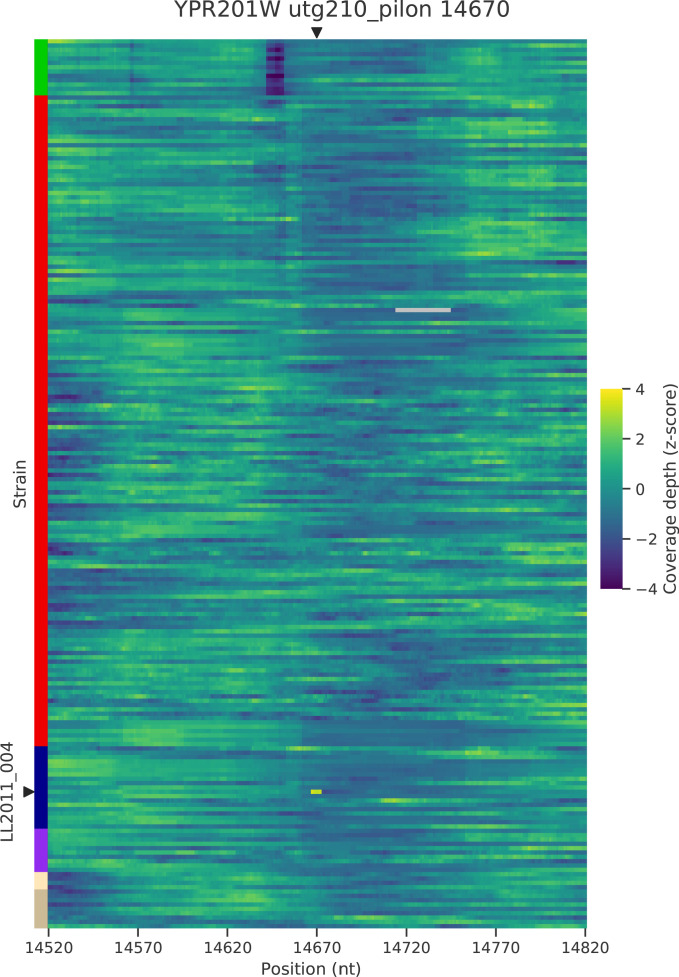
Figure 5—figure supplement 6. Normalized depth of coverage at locus YPR201W predicted to harbor Ty insertions.

Figure 5—figure supplement 6.

Rows correspond to the 206 wild strains. Strains with predicted insertions are labelled on the y axes. Positions on the x axes correspond to 300 bp windows centered at the predicted locus.
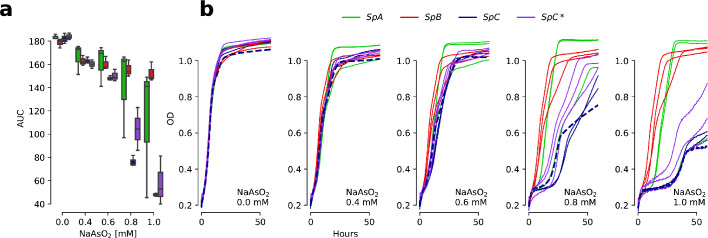
Figure 5—figure supplement 7. Determination of the optimal NaAsO2 concentration for growth measurements.

Figure 5—figure supplement 7.

(a) Growth curve area under the curve (AUC) at various concentrations of arsenite. Three representative strains per lineage were assayed. (b) Growth curves showing optical density (OD) of cultures through time at 0, 0.4, 0.6, 0.8, and 1 mM NaAsO2. The SpC strain LL2011_004 (which harbors a Ty1 insertion in ARR3) is highlighted with dotted curves. 0.8 mM NaAsO2 was chosen as it best captures variation among SpC and SpC* strains.
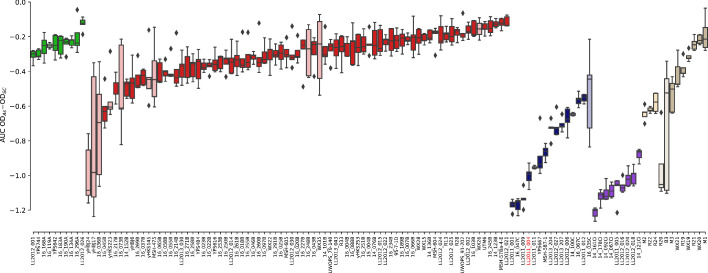
Figure 5—figure supplement 8. Growth measurements of the collection of 123 strains in 0.8 mM NaAsO2.

Figure 5—figure supplement 8.

The difference between growth curves in 0.8 mM NaAsO2 (As) and control medium (synthetic complete, SC) for individual replicates of each strain is plotted. Boxes in light color represent strains that were excluded from the linear models due to outlier variance or insufficient number of replicates (see Materials and methods). Strain LL2011_004 is highlighted in red.
Figure 5—figure supplement 9. Growth variation in NaAsO2 within the SpC lineage.

Figure 5—figure supplement 9.

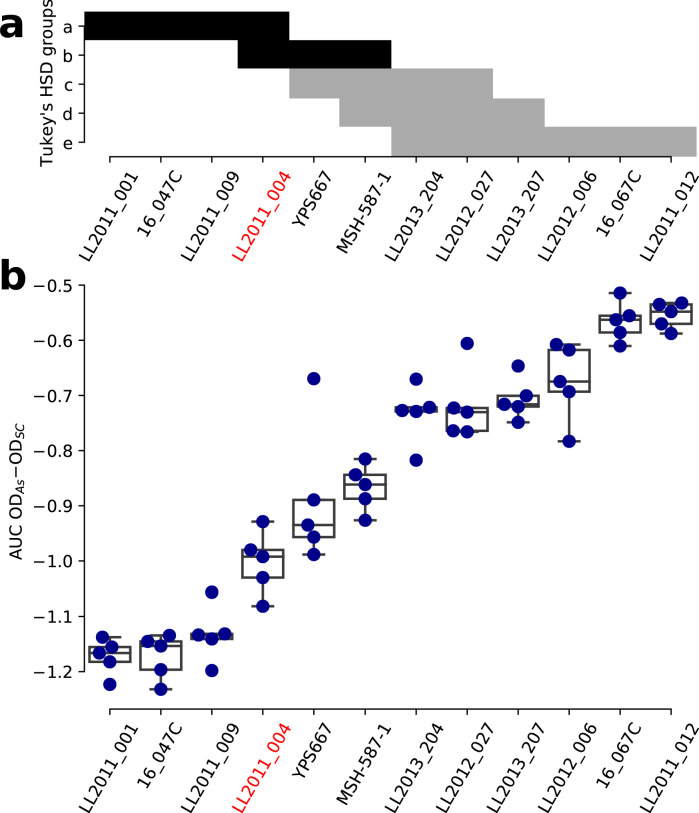
(a) Groups of strains that are not significantly different from a Tukey’s HSD test on the area under the curve (AUC) of the difference between growth in 0.8 mM NaAsO2 (As) and control medium (synthetic complete, SC) for the SpC lineage. Groups comprising the strain LL2011_004 are shown in black. (b) The AUC of the difference between growth curves in As and SC for the SpC lineage. One-way ANOVA p=3.72 × 10-26.
Figure 5—figure supplement 10. Distance and orientation of Ty insertions relative to neighboring genes.

Figure 5—figure supplement 10.

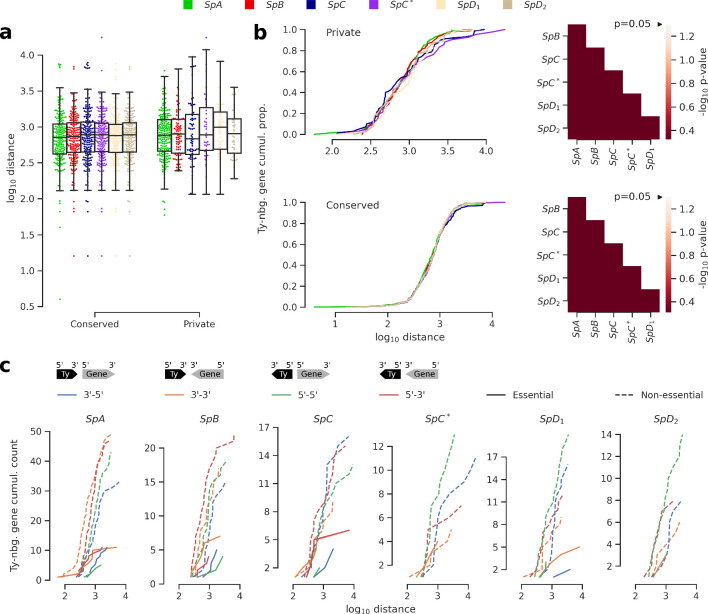
(a) Distributions of distance to neighboring genes for Ty insertions conserved across the six genomes or private to one of them. (b) Cumulative distributions of distance to neighboring genes for private (top) or conserved (bottom) insertions. Heatmaps show FDR-corrected p-values for pairwise Mann-Whitney U tests between distributions. Color maps are centered at the significance threshold of 0.05. (c) Cumulative distributions of orientation of private Ty insertions relative to neighboring genes.
Figure 5—figure supplement 11. Neighbor joining phylogenetic trees of genes with ORF-disrupting Ty insertions.

Figure 5—figure supplement 11.

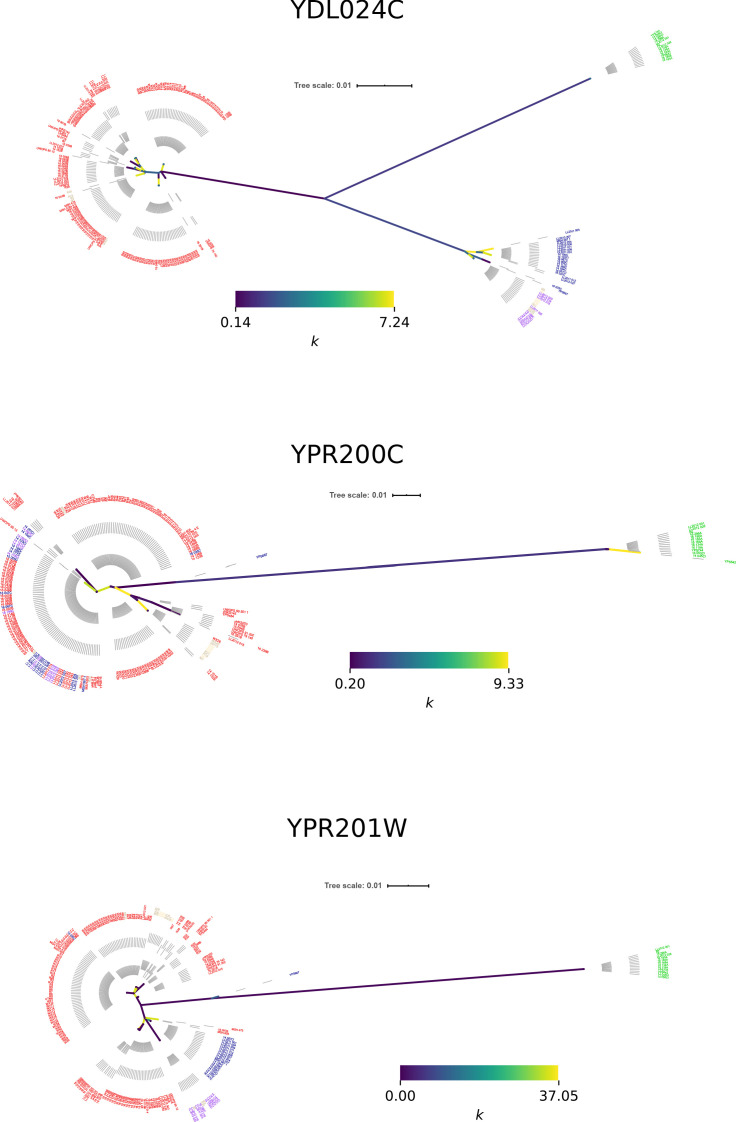
Branch color corresponds to the k parameter fitted by RELAX.