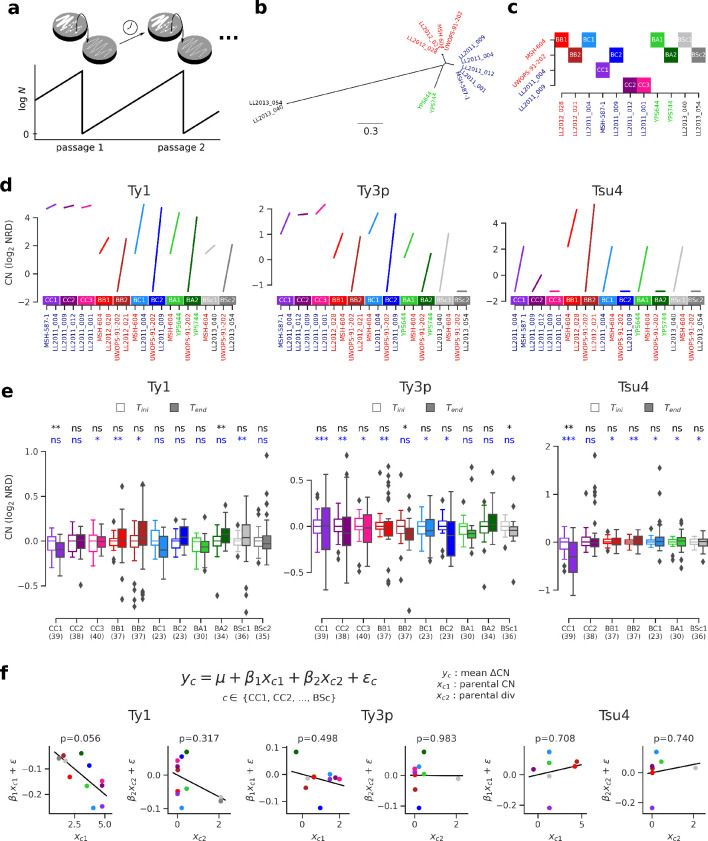
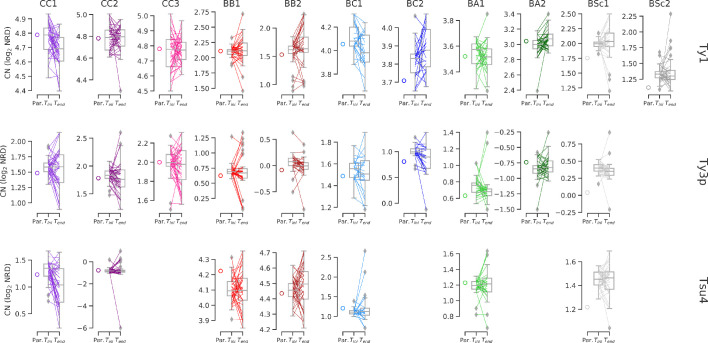
Figure 6. Ty copy number (CN) variation in mutation accumulation (MA) lines reveal no effect of parental divergence and major genotype-specific effects.
(a) Principle of an MA experiment on a yeast population. N corresponds to population size. (b) Bayesian phylogenetic tree of the parental haploid strains used to generate artificial hybrids. (c) Design of the crosses for the MA experiment. (d) Ty CNs in the haploid parental strains of each cross in c. (e) CN at the onset (Tini, empty boxes) and at the end (Tend, filled boxes) of the MA experiment. Whiskers span 1.5 times the interquartile range. FDR-corrected p-values of Wilcoxon signed-rank tests and Brown–Forsythe tests for the equality of variances are shown in black and blue, respectively. ns: p≥0.05, *: p<0.05, **: p<0.01, ***: p<0.001. (f) Linear models explaining the mean variation in CN (ΔCN = CNTend−CNTini) for a given cross as a function of the joint CN and genetic divergence of its parental strains. The p-value for each term in the models is shown. Scatter plots (CCPR plots) show the partial residuals for each independent variable, along with the fitted regression.


