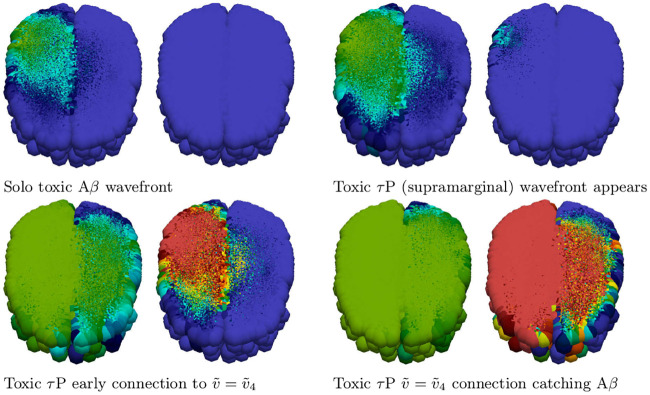
Fig 5. Front propagation in secondary tauopathy; brain connectome.
Each subfigure consists of a toxic Aβ concentration distribution (subfigure left) besides a toxic τP concentration distribution (subfigure right). Dark blue indicates the minimum concentration of c = 0.0 while bright red indicates the maximum of c = 0.5 for toxic Aβ and for toxic τP. (See also: supplementary S4 Video and supplementary S2 Data).

