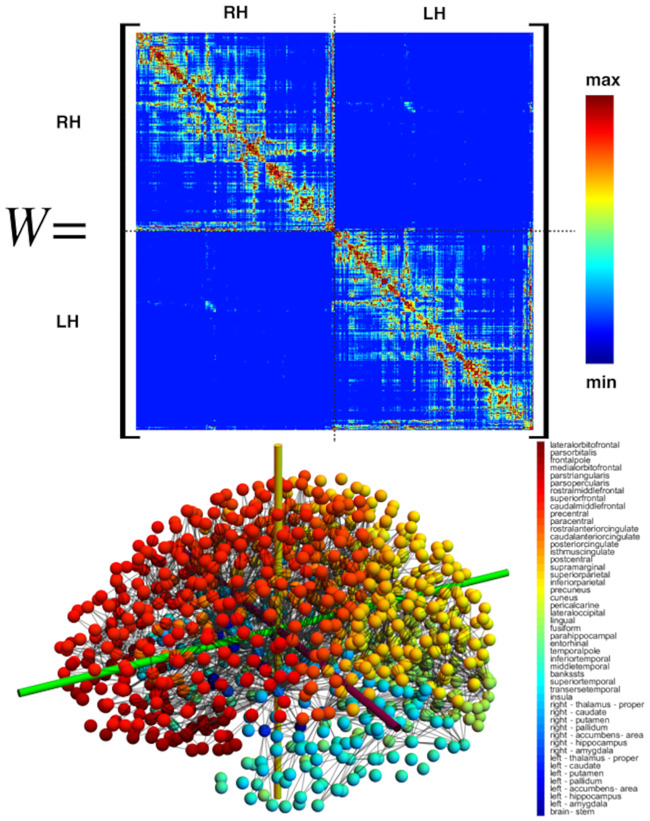
Fig 21. A high-resolution brain structural connectome graph.
(Bottom left) The average of 419 brain connectomes with V = 1, 015 vertices spanning (bottom right) 49 associated brain regions; the strongest 2,773 edge connections are shown. The weighted adjacency matrix (top) corresponding to the averaged connectome (bottom).

