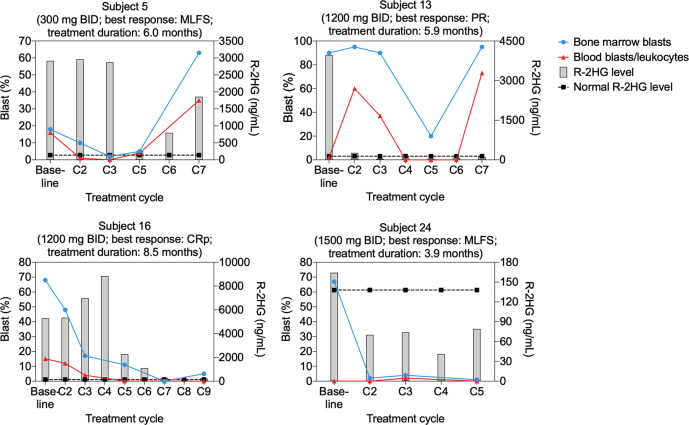
Fig. 2. Per-subject blast percentages and R-2HG levels from subjects who experienced clinical responses during BAY1436032 treatment.
Data from the four subjects who experienced clinical responses (1 CRp, 2 MLFS, 1 PR) is shown. Blast percentages are shown on the left Y-axis, plasma R-2HG levels on the right Y-axis and treatment cycle number on the X-axis. Bone marrow blasts are illustrated with blue circles and peripheral blood blasts/leukocytes with red triangles. R-2HG levels are represented by gray bars and the R-2HG level associated with healthy individuals (138 ng/mL) is shown as black squares connected by a dotted black line.

