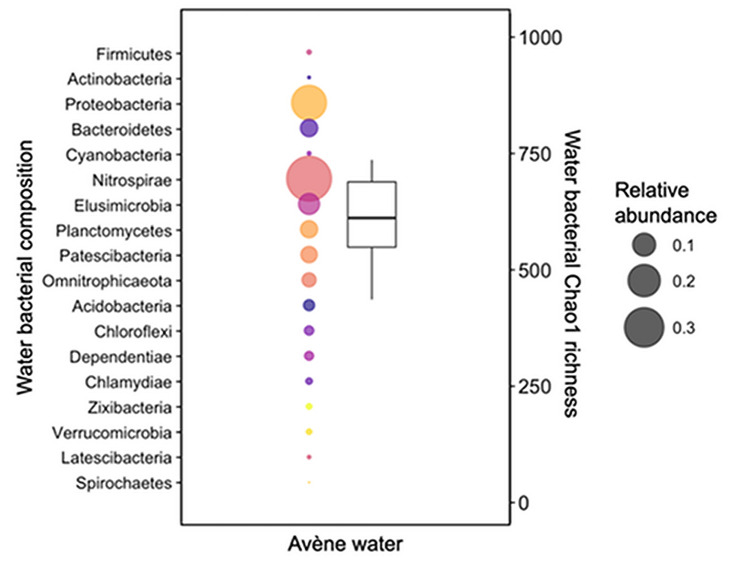
Fig. 1.
Bacterial composition and richness of Avène Thermal Spring Water. Sample composition and diversity are the average of samples taken between December 2014 and September 2018, with four samples taken per year. Bubble plots represent the bacterial composition (for simplicity, only major phyla shown). Each phylum is represented by a different color. The size of the bubble represents the relative abundance, as indicated in the legend. The y-axis for the bubble plots is on the left. The boxplot represents the bacterial Chao1 richness, with the y-axis on the right.
Data adapted from Bourrain et al. [11]

