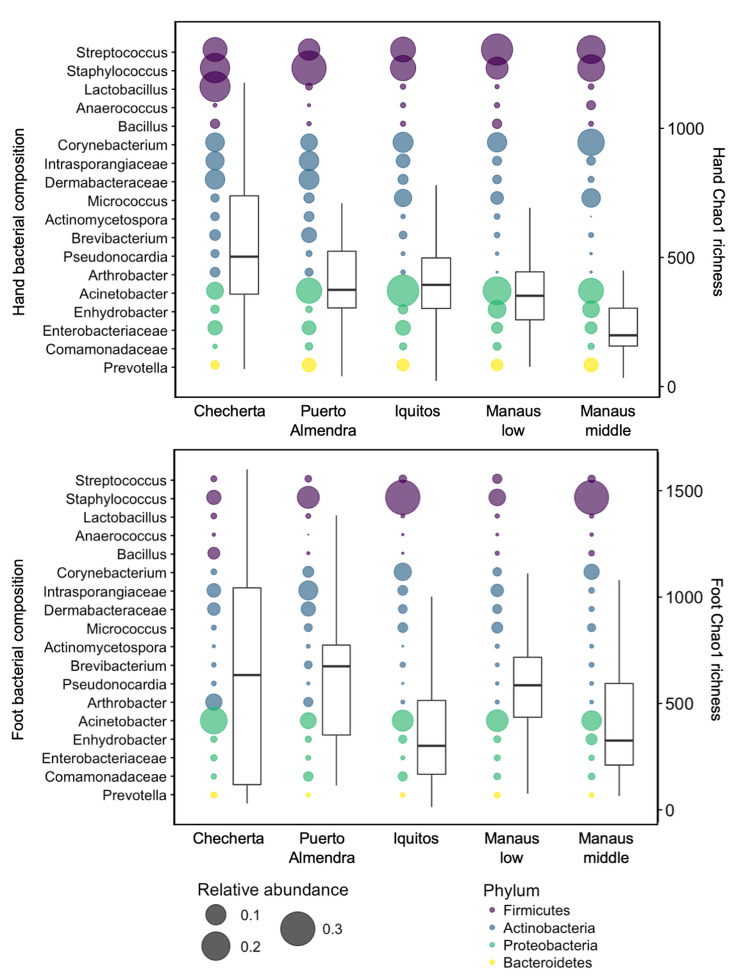
Fig. 2.
Human bacterial composition across an urbanization gradient in the Amazon in South America. Sites ranged from a remote village isolated in the Amazon rainforest (Checherta), to a rural village (Puerto Almendra), a large town (Iquitos), and the lower and middle socioeconomic class of a metropolis city (Manaus). Samples presented per skin sample site: right hand (top panel), right foot (bottom panel). Bubble plots, with the y-axis on the left, represent the bacterial composition (for simplicity, only the major taxa are shown). The size of the bubble represents the relative abundance. Boxplots, with the y-axis on the right, represent the bacterial Chao1 richness. Firmicutes are depicted in purple, Actinobacteria in blue, Proteobacteria in green, and Bacteroides in yellow.
Data adapted from McCall et al. [37]

