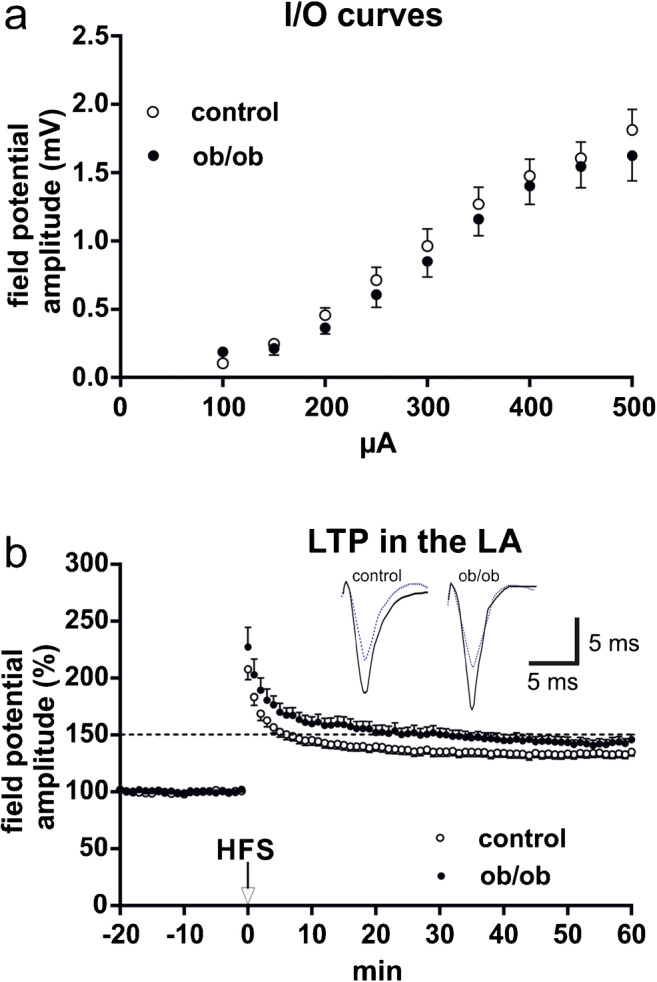
Fig. 3.

Baseline activity and LTP in the LA. a Input/output curves (I/O curves) of field potential amplitudes (evoked at EC fibers) recorded in the LA of ob/ob mice and controls (n = 18 slices per group). Basal transmission was not significantly different between the genotypes. b LTP can be induced by HFS of external capsule fibers in both, ob/ob mice and controls (n = 18 slices per group). In both cases, LTP was not only induced but also maintained over a longer time. The ob/ob mice display a stronger LTP than controls. Data points represent averaged amplitudes (mean ± SEM) normalized to baseline. Representative traces were recorded 5 min prior to tetanus (dashed lines) and 60 min after HFS (solid lines)
