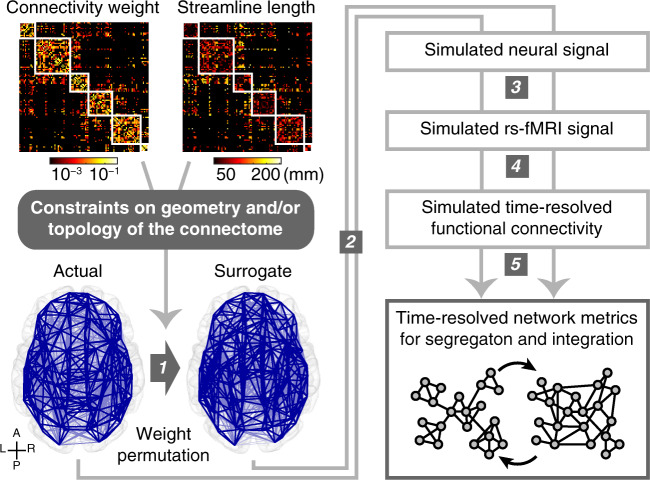
Fig. 1. Workflow of surrogate data analysis.
(1) Constructing surrogate data of the connectome by permuting structural connectivity weights of the actual data with geometric and/or topological constraints depicted in Fig. 2. Blue lines represent regional structural connections (A: anterior; P: posterior; L: left; R: right). (2) Simulating spontaneous oscillatory neural signal using phase oscillator models coupled based on structural connectivity weights and lengths in the connectome. (3) Converting simulated neural signal into simulated rs-fMRI signal using a hemodynamic model. (4) Computing time-resolved functional connectivity of simulated rs-fMRI signal using tapered sliding windows. (5) Calculating global network measures of time-resolved functional connectivity to track dynamic fluctuations between segregated and integrated patterns of functional connectivity. Small circles represent brain regions, and lines between them indicate regional functional connections.

