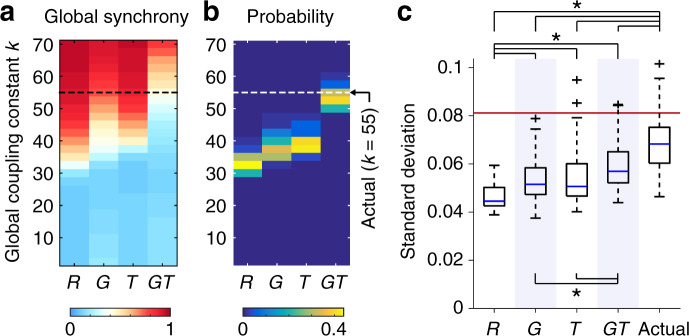
Fig. 4. Dynamics of simulated neural signal and functional connectivity patterns.
a The global synchrony level of neural signal simulated with the surrogate data. The averages over 50 simulation samples are presented. The global synchrony level similar to those averaged over simulation samples generated from the actual data (0.37) is shown in close to white. b Probability distribution of the global coupling constant k selected so that the global synchrony level of simulated neural signal became closest to that simulated with the actual data. c The magnitude of dynamic fluctuations in mean PC (boxplot elements: center line, median; box limits, upper and lower quartiles; whiskers, 1.5 times interquartile range; “plus” symbols, outliers; these definitions are equivalent throughout the paper). Blue shading is used for improving the visibility of the boxplots. The magnitude was quantified by the SD of mean PC across time. The median SD computed from empirical rs-fMRI data is shown by a red vertical line. An asterisk indicates significant differences between the SDs (p < 0.05, FDR corrected across all the 10 comparisons). The exact p and n are shown in Supplementary Table 1.

