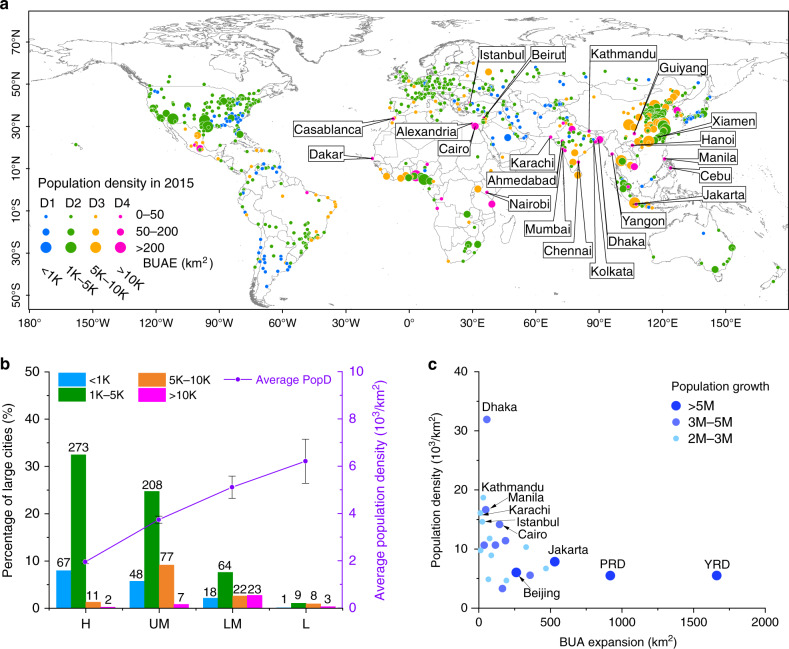
Fig. 2. Distribution of large cities with the population density.
a Distribution of the 841 large cities at four different levels of the population density (PopD, unit: 1/km2) in 2015. D1: 0 < PopD ≤ 1K, blue points; D2: 1K < PopD ≤ 5K, green points; D3: 5K < PopD ≤ 10K, orange points; D4: PopD > 10K, magenta points. b Bars are the percentages of the 841 large cities for four PopD levels in 2015 at four economic levels. Error bars show SEM for each economic level. c Relationship between PopD in 2015 and the BUA expansion from 2001 to 2018 of the 22 large cities with population growth larger than 2M. YRD Yangtze River Delta, PRD Pearl River Delta. The size of the dots refers to the population growth at different levels.

