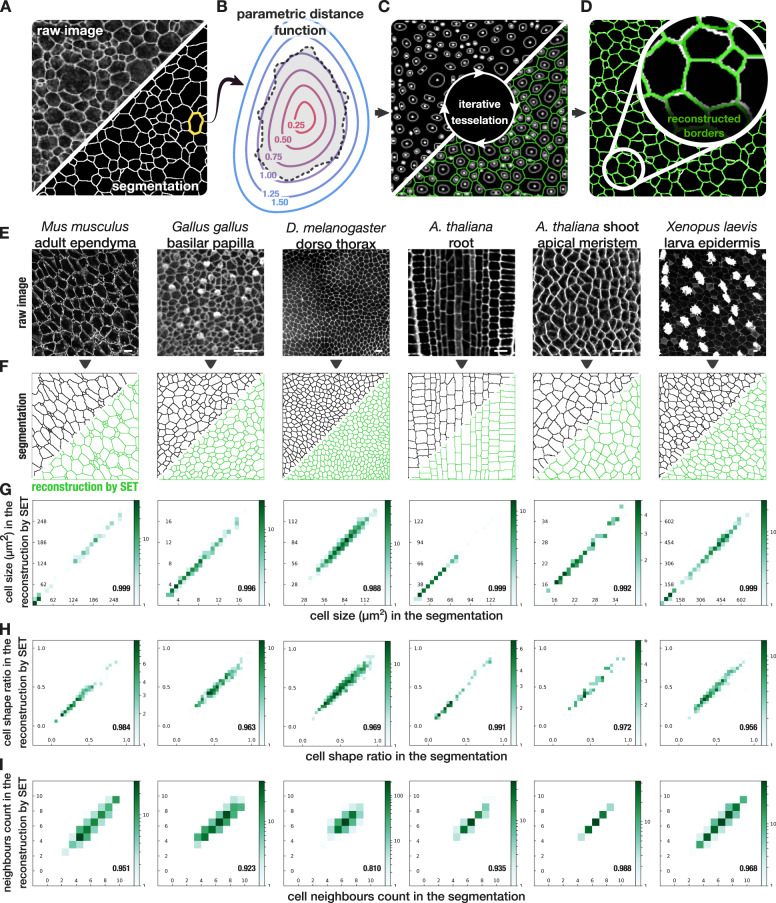
Fig. 1. Reconstruction by SET: parametric modeling and accurate reconstruction of an epithelial cell tessellation.
a–d Flowchart of the SET method. a Top left, an image of P1 mouse ependyma in which cell junctions were labeled with ZO1 antibody (Supplementary Fig. 1) and, bottom right, the segmentation of all cells in this image. b Fitting of the level one of AMAT distance function on each cell such that each pixel on the cell border is approximately at a distance 1 from the cell center. c Starting from the initial cell positions and using all AMAT distance functions previously defined, an iterative process (Lloyd-like algorithm) is used to affect all pixels to the closest cell until convergence. d Visualization of the reconstruction by SET in green over the original segmentation in white. e Raw images of various epithelia with marked cell borders (membranes or cell walls, see “Acknowledgements”, “Methods”, and further results for images ressources), scale bar: 10 µm. f For each panel, top left in gray is the segmentation of the image in e and, bottom right in green is the corresponding reconstruction by SET. g–i Comparison of quantitative features computed on each single cell from segmented tissue and on the corresponding cell in the reconstruction by SET. Pearson coefficient correlation calculated on all cells except the border cells (as they are incomplete). g Cell size. h Ratio of the minor axis to the major axis of the cell. i Number of cell neighbors. For all plots N = 1 image.

