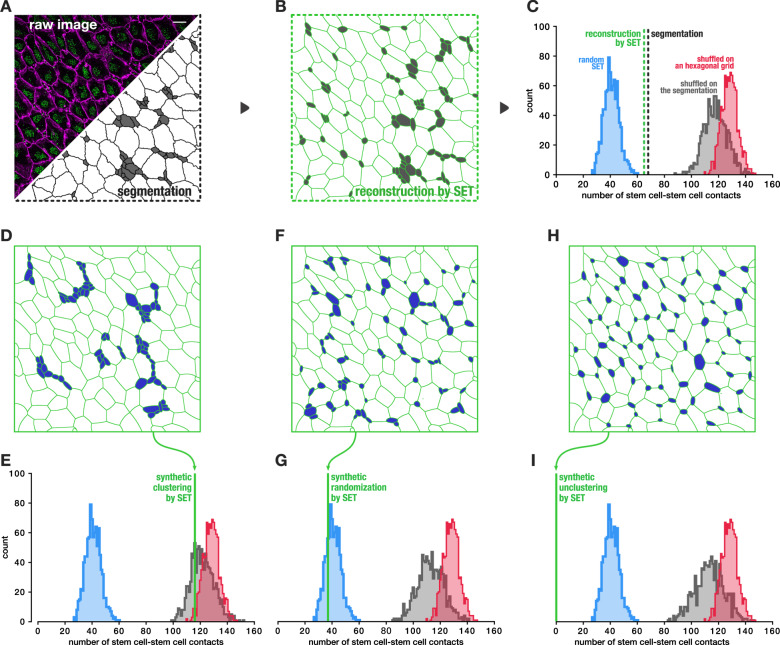
Fig. 3. Stem cells are organized in clusters surrounded by ependymal cells along the ventricular surface of the lateral ventricles, comparison with other approaches.
a Top left, image of an en face view of the lateral ventricular surface of a P30 labeled with ZO1 antibody (magenta) marking the cell junctions and FOP (green) marking the centrioles, scale bar: 10 µm. Bottom right the image segmentation with stem cells colored in gray. b Reconstruction of a using SET, stem cells in gray. c Count of the stem cell to stem cell contacts in the reconstruction by SET panel b (dotted green), in the segmentation panel a (dotted black), and null distributions of the same feature as generated with three methods including ours: SET where cells are randomly moved 1000 times (in blue), a model where stem cells are shuffled over a hexagonal grid (in red), and a model where stem cells are shuffled over the actual segmentation (in black) (“Methods” and Supplementary Fig. 6). The p value of the reconstruction by SET relative to the null distribution obtained with a 1000 random SET is 0.001. d, f, h Evaluation of the three models against known synthesized patterns all produced from image a. d, e Synthesized clustered stem cells. Our approach by random SET assesses that pattern d is clustered as it safely rejects the null hypothesis with a p value ≤ 0.001 (green line outside our null distribution), the two other models consider pattern d as random while it is obviously clustered. f, g Synthesized randomly introduced stem cells. Our approach by random SET cannot reject the null hypothesis (green line inside our null distribution), the two other models consider pattern f as unclustered (stem cells would repulse each other). h, i Synthesized repulsed stem cells (anti-clustering). Unclustered/repulsed stem cells are detected as unclustered by the three models. N = 1 image.

