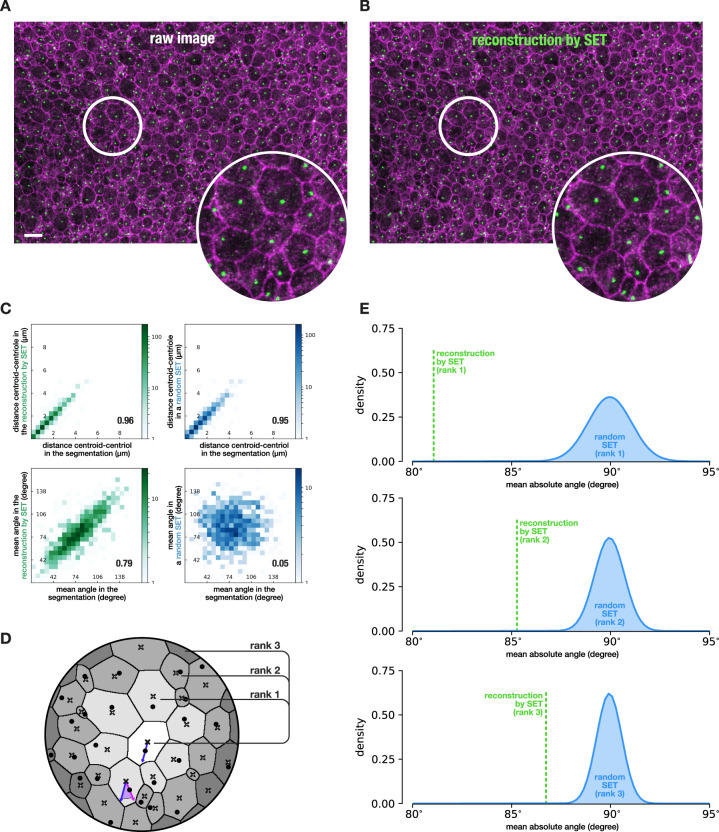
Fig. 5. Planar polarity organization of the centrioles in E18 mouse ependyma.
a Crop of the maximum intensity projection from a stack of E18 mice ventricular wall with junction labeled with zo1 and centrioles labeled with centrin and ninein, scale bar: 10 µm (full image in Supplementary Fig. 10). b Reconstruction of image a by SET. Additionally, the content of each cell was morphed from its original location in a to the corresponding reconstructed cell in b using barycentric coordinates so as to obtain the new location of the centrioles in random SET. c Content morphing validation. Quantitative features computed on the content of each cell were preserved after morphing both on the reconstruction by SET and on random SET. Furthermore, quantitative features computed on the content of each cell relative to the neighbor cells were expectedly preserved after morphing on the reconstruction by SET and expectedly lost on random SET. Correlations are Pearson correlation. d Description of the quantitative feature considered. Crosses denote cell centroids while dots denote the location of the centriole in each cell (this location can be retrieved in any SET thanks to the morphing step). The vector from the centroid to the centriole is thus defined for all cells. The angle between this vector in the light gray cell (in blue) and the same vector in all the other cells of a given rank (in purple) is computed and averaged by rank to obtain a mean angle value per cell per rank. This value is then averaged per image. e Distributions of the value described in d for random SET (in blue) and for the reconstruction by SET (in green) both from image a for ranks 1 to 3. The distribution of mean absolute angles was approximated by a Gaussian density thanks to the Central Limit Theorem and p values for the reconstructed images by SET were computed: 1.94 × 10⁻¹⁶ for rank 1, 3.057 × 10⁻¹⁰ for rank 2, and 3.021 × 10−07 for rank 3. N = 1 image.

