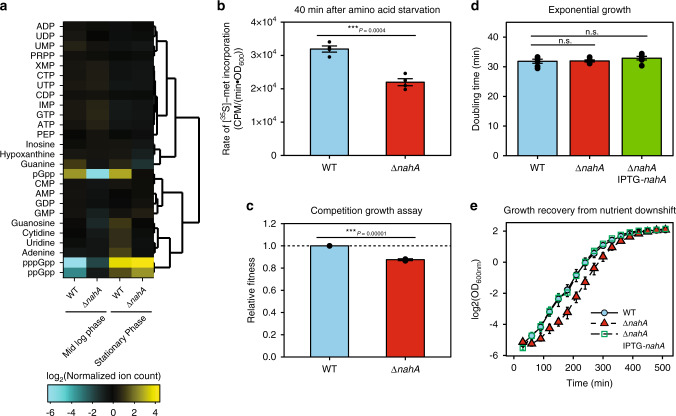
Fig. 4. The effect of NahA on purine nucleotides, translation, fitness, and growth recovery of B. subtilis cells.
a Hierarchical clustering of selected metabolites in exponential growth and stationary phase wild type and ΔnahA cells. Metabolites were measured by LC-MS. Normalized ion count is ion count per OD600nm per unit volume of the culture. b Protein translation rate of wild type and ΔnahA cells 40 min after amino acid starvation. Translation rate was measured by a 5-min pulse of [35S]-methionine incorporation into TCA-precipitable fraction. Error bars represent standard errors of the mean from three replicates. c Relative fitness of ΔnahA and wild type strains obtained from a 7-day serial dilution competition assay. Error bar represents standard deviation from three repeats. d Doubling times of ΔnahA and wild-type cells in log phase. A two-tailed two-sample equal-variance Student’s t test was performed between samples indicated by asterisks. Asterisk indicates statistical significance of difference (*P ≤ 0.05, ***P ≤ 0.001, n.s. P > 0.05). e Growth recovery from transient nutrient downshift. Log phase cultures of wild type, ΔnahA and nahA complementation (ΔnahA IPTG-nahA) strains in rich media with 20 amino acids were firstly downshifted in minimum media without amino acids for 10 min, and then diluted in rich media for outgrowth. Result of growth recovery from similar downshift with the presence of guanosine is shown in Figure S6c. Error bars in d, e represent standard errors from six replicates.

