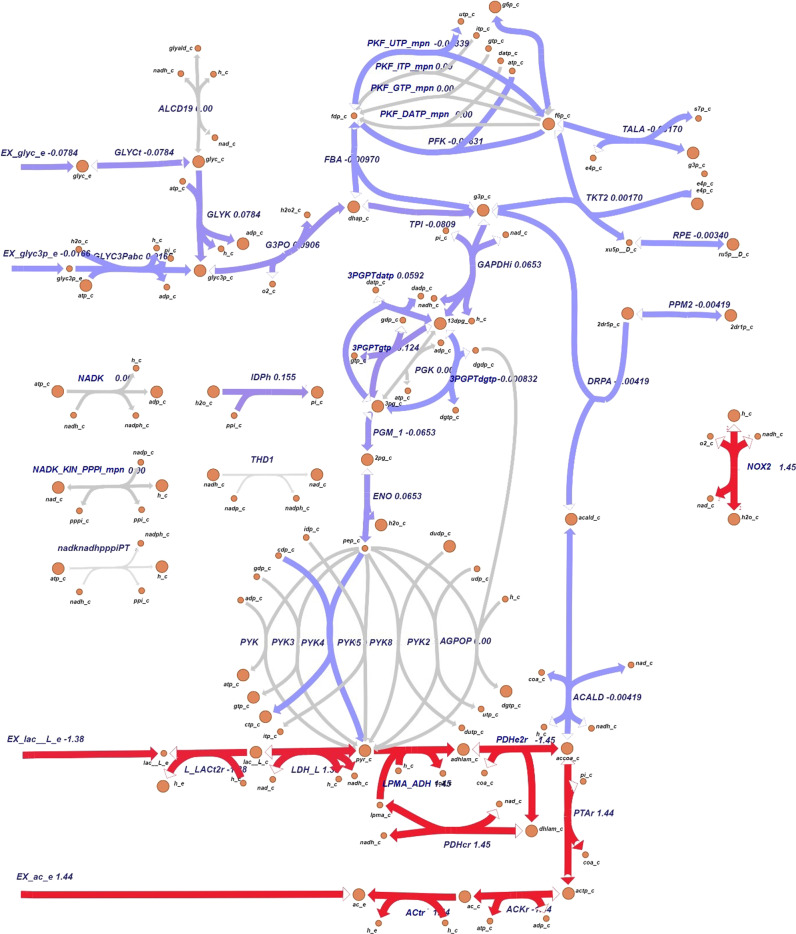
Fig. 7. Visualization of flux differences in M. pneumoniae glycolysis pathway.
Visualization of flux differences in glycolysis reaction when M. pneumoniae is growing under hypoxia (oxygen uptake 6 mmol.gDW−1.h−1) respect to baseline oxygen availability (7.54 mmol.gDW−1.h−1). Purple is indicative of a small difference (absolute value of flux change <±1) and red of a more considerable one (absolute value of flux change ≥±1). Gray arrows represent reactions that are unused or whose flux does not change when oxygen availability is reduced to 6 mmol.gDW−1.h−1.

