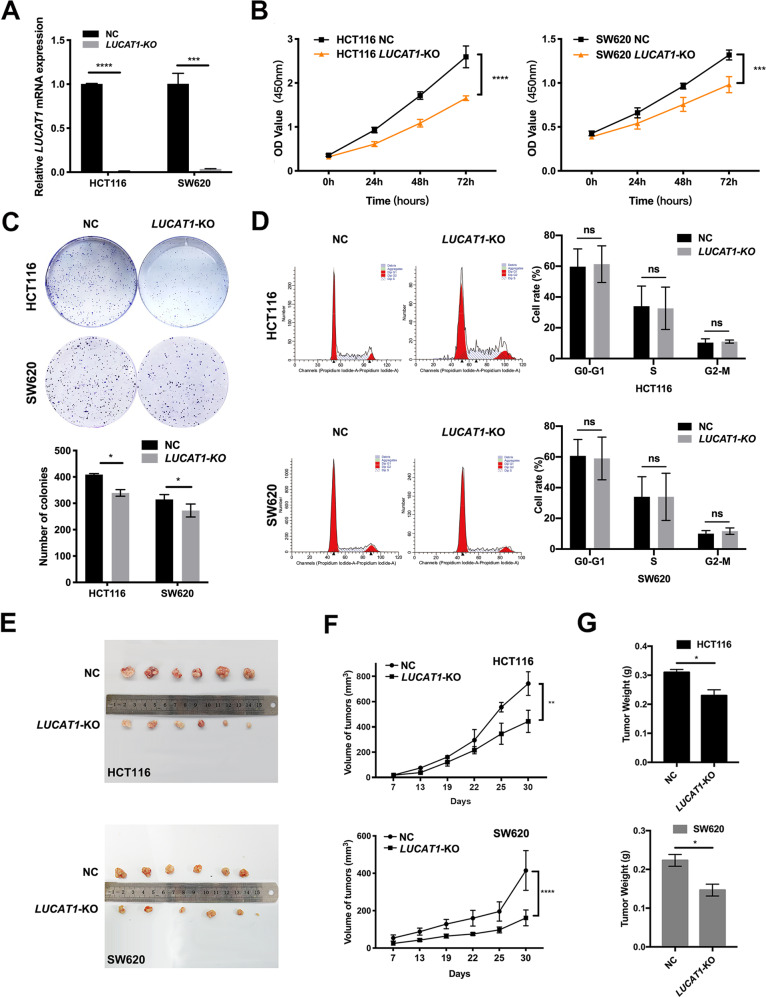
Fig. 2. LUCAT1 promotes CRC cell proliferation in vitro and in vivo.
(A) The expression of LUCAT1 was detected by qRT-PCR in HCT116 cells, and cells transfectedwith the CRISPR/Cas9 system differed significantly between the LUCAT1 knockout (LUCAT1-KO) and control (NC) groups in HCT116 and SW620 cells. GAPDH was used as an internal control. (B) Reduction in the proliferation ability of LUCAT1-KO HCT116 and SW620 cells compared with the control (NC) cells by a CCK8 assay. (C) Reduction in colony formation ability of LUCAT1-KO HCT116 and SW620 cells compared with that of the control (NC) cells by a colony formation assay. The bar graph indicates the number of colonies, *p < 0.05. (D) Cell cycle of LUCAT1-KO HCT116 and SW620 cells compared with the control (NC) was analyzed by flow cytometry. The distribution of the cell cycle is shown in the graphs. The results are presented as the mean±s.d. and are representative of at least three independent experiments. (E) Images of xenograft-transplantednude mousemodels (n = 6) and dissected tumors 30 days after injection with LUCAT1-KO SW620 cells, LUCAT1-KO HCT116 cells and their corresponding NC cell lines. (F) Tumor growth curves of LUCAT1-KO HCT116 and SW620 cell and control (NC) cell groups in the xenograft model. (G) Xenograft tumor weight for LUCAT1-KO HCT116 and SW620 cell and control (NC) cell groups in the xenograft model. The results are presented as the mean±s.d. and are representative of at least three independent experiments. *p < 0.05, **p < 0.01, ***p < 0.001, ****p < 0.0001, ns p > 0.05.

