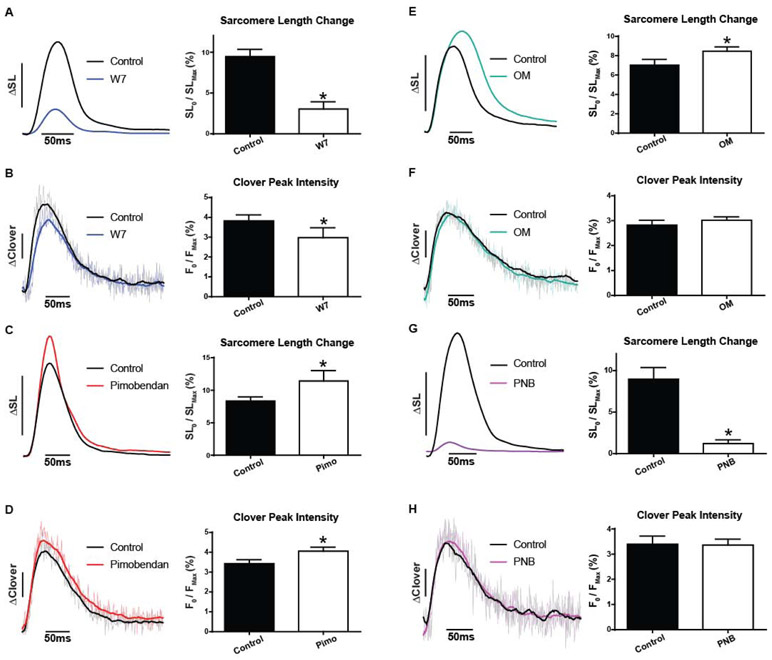
Figure 3. Myofilament-targeted small molecules probe function in live cardiac myocytes. TnC-TnI modulation.
A, Ensemble average traces of SL shortening (left) in isolated myocytes before and after treatment with 10 μM W7 and summary statistics (right) from sarcomere dynamics reveal decreased contractile amplitude (n=8 pairs). B, Ensemble average traces of Clover transient (left) in isolated myocytes before and after treatment with 10 μM W7 and summary statistics (right) of Clover signal reveal decreased peak fluorescence intensity (n=8 pairs). C, Ensemble average traces of SL shortening (left) in isolated myocytes before and after treatment with 10 μM Pimobendan with summary statistics (right) from sarcomere dynamics showing increased contractile amplitude (n=11 pairs). D, Ensemble average traces of Clover signal (left) in isolated myocytes before and after treatment with 10 μM Pimobendan and summary statistics (right) of Clover intensity changes reveal increased peak fluorescence intensity (n=11 pairs). Myocytes measured at 37°C with 0.2Hz stimulation; ΔSL bar represents a 5% change from baseline, ΔClover bar represents a 1% change from baseline. Mean ± S.E.M are presented, Paired two-tailed t-test: *P < 0.05. Myosin targeted small molecules probe sarcomere activation in live cardiac myocytes. E, Ensemble average traces of SL shortening (left) in isolated myocytes before and after treatment with 250 nM Omecamtiv mecarbil and summary statistics (right) from sarcomere dynamics reveal increased contractile amplitude (n=14 pairs). F, Ensemble average traces of Clover signal (left) in isolated myocytes before and after treatment with 250nM Omecamtiv mecarbil and summary statistics (right) of Clover intensity changes reveal no difference in peak fluorescence intensity (P = 0.2847) (n=17 pairs). G, Ensemble average traces of SL shortening (left) in isolated myocytes before and after treatment with 10μM para-Nitroblebbistatin and summary statistics (right) from sarcomere dynamics reveal decreased contractile amplitude (n=8 pairs). H, Ensemble average traces of Clover signal (left) in isolated myocytes before and after treatment with 10μM para-Nitroblebbistatin and summary statistics (right) of Clover intensity changes reveal no difference in peak fluorescence intensity (P = 0.8930) (n=8 pairs). Myocytes were measured at 37°C with 0.2Hz stimulation; ΔSL bar represents a 5% change from baseline, ΔClover bar represents a 1% change from baseline. Mean ± S.E.M are presented, Paired two-tailed t-test: *P < 0.05.

