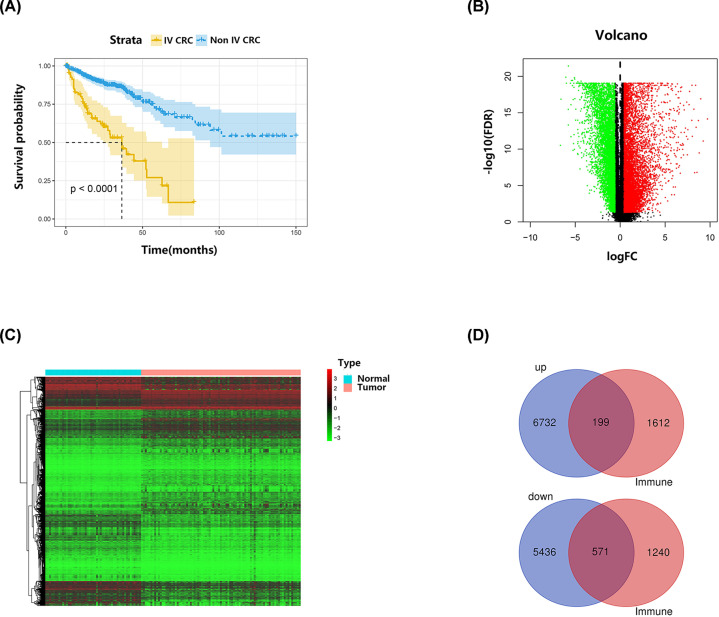
Figure 1. The survival analysis of CRC patients and identification of candidate DE-IRGs.
(A) Kaplan–Meier survival curves of the stage IV CRC patients and the remaining 493 non-stage IV patients from TCGA. (B) The volcano figure of DEGs between tumor tissues and normal tissues. (C) The heatmap of DEGs between tumor tissues and normal tissues. (D) The venn diagram of significantly up-regulated and down-regulated candidate DE-IRGs in intersection of DEGs and IRGs.

