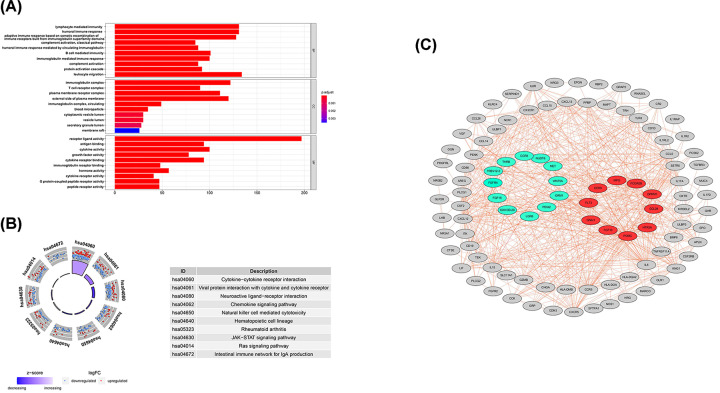
Figure 2. Functional enrichment and the PPI network analyses of the candidate DE-IRGs.
(A) GO analysis. (B) KEGG pathway analysis. (C) The PPI network of candidate DE-IRGs was constructed by Cytoscape software based on STRING database. Red nodes represented 10 hub genes with the most edges. Green nodes represented 12 genes that were eventually included in the prognostic risk score model.

