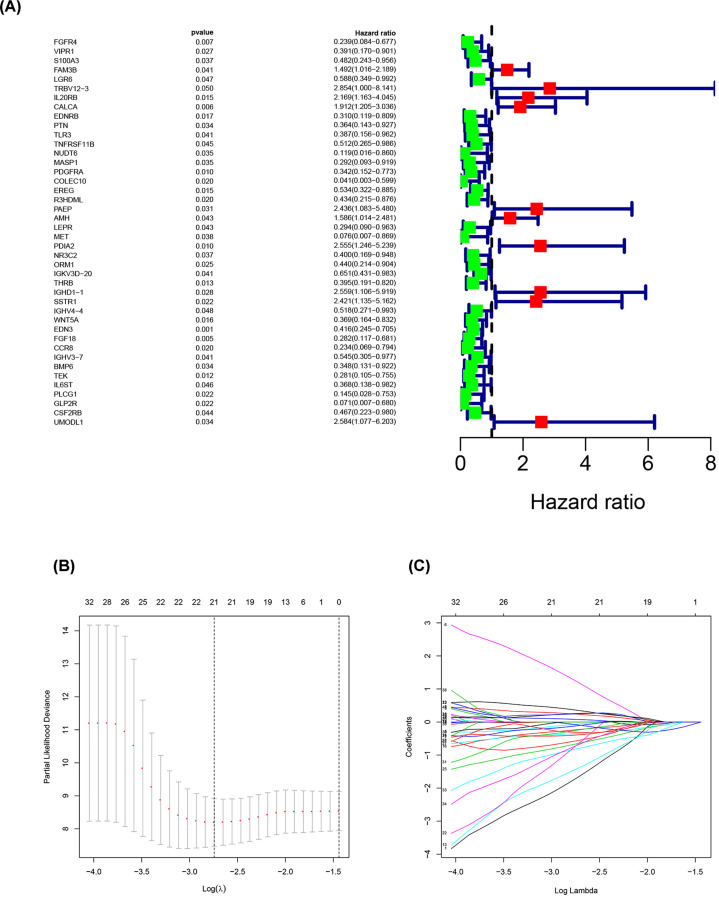
Figure 3. Establishment of prognostic risk score model.
(A) Prognostic values of survival-associated DE-IRGs: Forest plot of survival-associated DE-IRGs. (B) Tuning parameter (λ) selection in the LASSO logistic regression used 10,000-fold cross-validation via minimum criteria. The binomial deviance was plotted versus log (λ). (C) LASSO coefficient profiles of 63 survival-associated IRGs. A coefficient profile plot was produced versus the log (λ).

