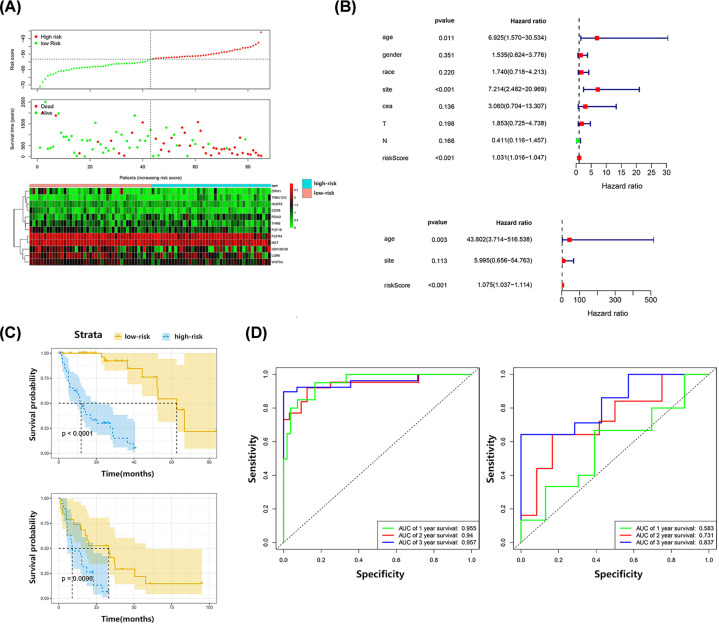
Figure 4. Validation of the prognostic risk score model.
(A) Risk score distribution, survival status, and expression patterns of 12 included genes in risk score model for high- and low-risk patients from training set. (B) Univariate and multivariate Cox regression analysis of OS. (C) Kaplan–Meier survival curves of high- and low-risk patients in training set and verification set. (D) The time dependent ROC at 1-, 2-, and 3-year OS of training set and verification set.

