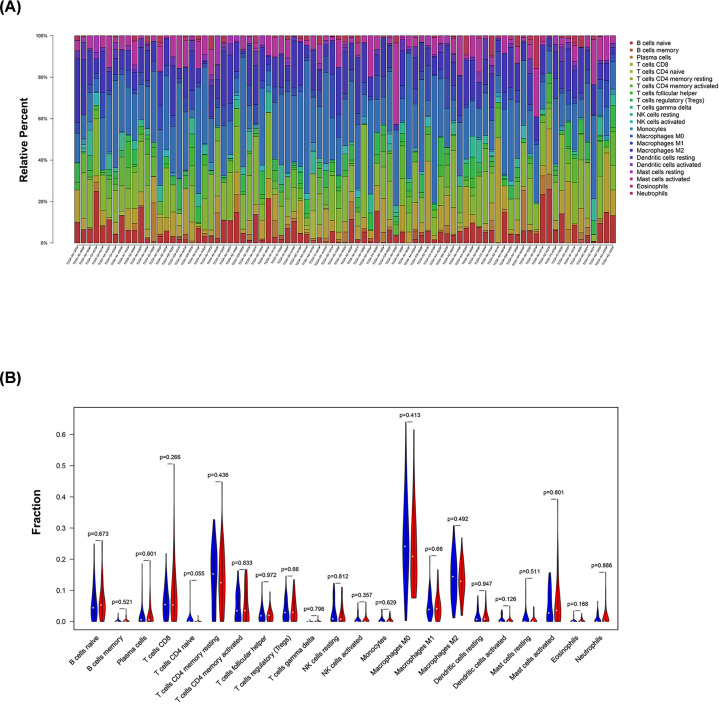
Figure 6. Landscape of immune infiltration in high- and low-risk patients with stage IV CRC.
(A) Bar plots visualizing relative proportion of 22 immune cells in high- and low-risk patients. (B) Violin plots visualizing significantly different immune cell infiltrations between high- and low- risk patients.

