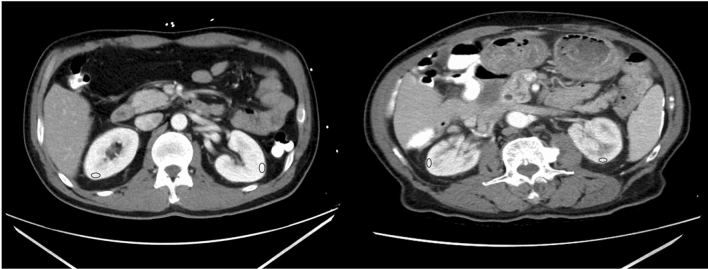
Fig. 2.
Baseline contrast-enhanced CT image of (left) a 54-year old male COVID-19 patient who did not develop AKI and (right) an 89-year old male COVID-19 patient who developed AKI. ROIs in the renal cortex are shown in blue. ROIs in the aorta were drawn at the level of the renal bifurcation, and are thus not displayed in these images. The relative enhancement in the cortex of the kidneys of the patient that developed AKI was lower than in the patient that did not develop AKI (CAEI 0.75 vs. 1.01), indicative of reduced blood flow

