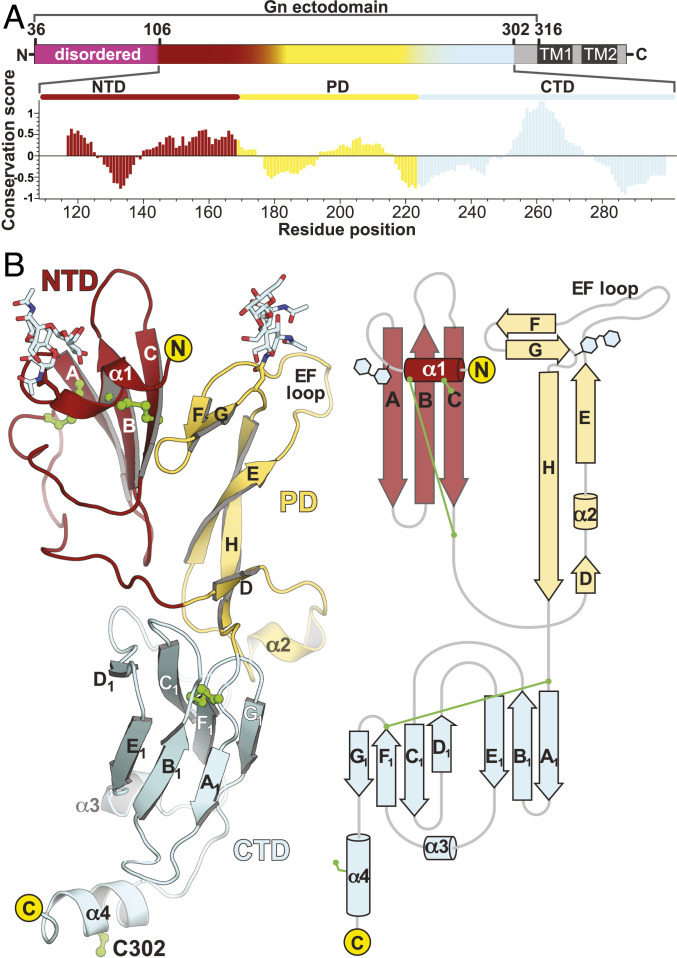
Fig. 1.
Overview of sGN crystal structure. (A, Top) A linear representation of the TSWV GN gene product. Magenta represents the disordered N-terminal extension, red shows NTD, yellow shows PD, and pale cyan shows CTD. In gray are regions that were not included in the expressed construct. Dark gray are the putative transmembrane domains. (Bottom) A graphical representation of CONSURF (43) conservation analysis. Scores account for evolutionary distance and are normalized to units of SD. Zero represents the average evolutionary rate, and <0 indicates increasing conservation. The scores were then averaged in a window of ±7 residues (i.e., 15 total residues) for every residue and plotted as seen in the histogram. The color scheme represents the three domains of sGN’s structure. (B) A cartoon representation (Left) and topology depiction (Right) of sGN crystal structure. Cysteine residue side chains are in green.

