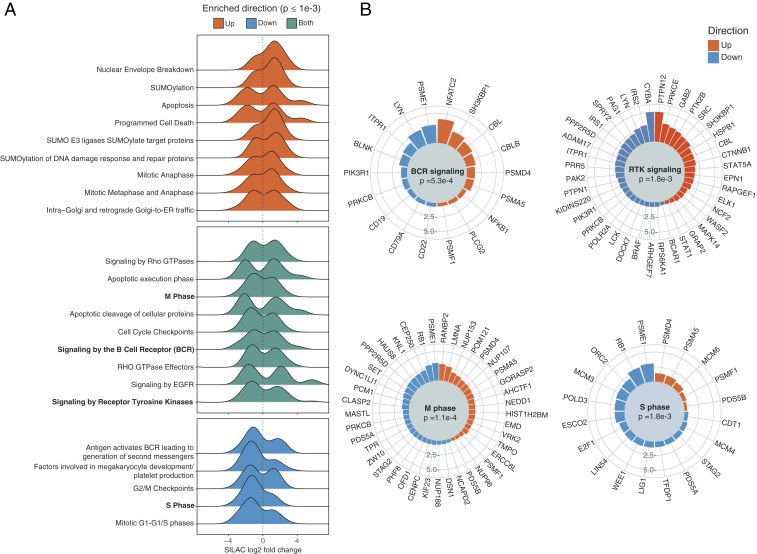
Fig. 3.
Pathway enrichment analysis of phosphorylation events induced by LMP2A. (A) Distribution of log2 SILAC ratios for LMP2A effectors exhibiting significantly increased (red) or decreased (blue) phosphorylation in the LCL GPome, for significantly enriched Reactome pathways. Pathways enriched in both protein sets are shown in green. (B) Radial barplot of absolute log2 SILAC ratios for members of selected pathways from A. Proteins are represented by their most regulated p site, defined as the largest absolute SILAC fold change.

