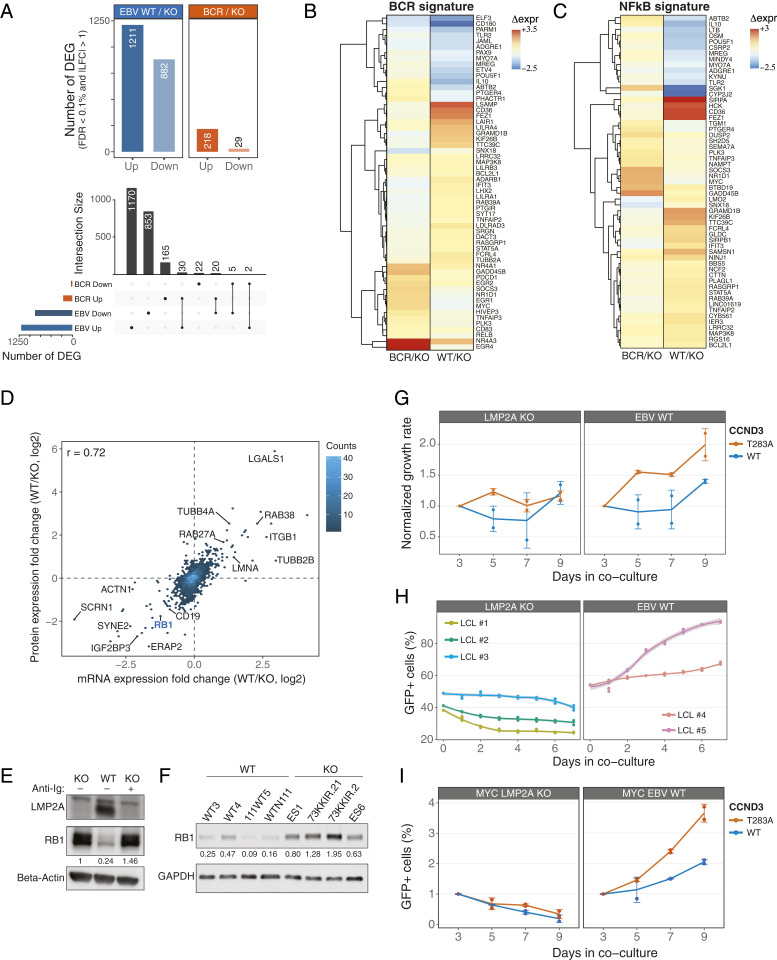
Fig. 4.
LMP2A interferes with the RB1 cell-cycle checkpoint to promote cell proliferation. (A) Total number of differentially expressed genes (DEGs) for the indicated comparisons (Top). The UpSet plot (Bottom) shows the overlap between the indicated sets of DEGs. (B and C) Hierarchical clustering of mRNA expression patterns for BCR (B) and NF-κB (C) gene signatures. Regularized log2 expression values are row − mean subtracted. (D) Density scatterplot of changes in protein (log2 SILAC ratio) and mRNA expression (log2 fold change) levels in EBV-WT relative to LMP2A-KO LCLs. The number of genes in each bin is indicated (color key). The Spearman’s rank correlation coefficient is shown, and selected genes are labeled. (E and F) Immunoblot analyses of RB1 expression in EBV-WT and LMP2A-KO cell lines used in the MS analysis (E) and in additional LCLs (F). (G) Normalized GFP+ expression after transduction of retrovirus expressing GFP-tagged WT or mutant CCND3 in LCLs. Changes in %GFP were normalized to day 3 posttransduction. (H) Percentages of GFP+ LCLs from coculturing transduced GFP-tagged T283A CCND3 cells with parental lines. (I) Same as H, for MYC-overexpressing cells. Graphs represent combined data from two (H and I) or three (G) experiments.

