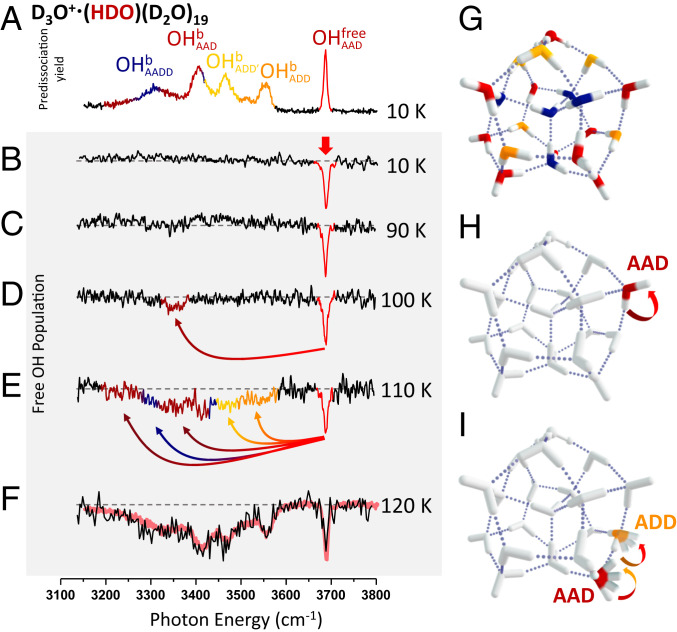
Fig. 4.
Temperature-dependent evolution of the photobleaching spectra corresponding to a bleach-probe delay of 50 ms and fixing the probe laser to monitor population of the isotopomer with the isotopically labeled OH group in the nonbonded (red) site . (A) Vibrational spectrum of all isotopomers at 10 K and (B–F) hole burning spectra at 10 to 120 K. The red trace in F reproduces the single laser spectrum of the entire isotopologue (all sites occupied) from Fig. 1E. The vertical red arrow in B indicates the probe laser frequency, whereas the curved arrows in D and E indicate that the appearance of additional dips arise from OH migration from the site to various other sites when their populations are depleted by the bleach laser, (G) a representative low-energy PD structure, (H) a possible pathway for OH migration at 100 K, and (I) schematic illustration of more complex pathways that likely operate at higher temperatures, where the ribbon arrows indicate the directions of OH group rotations.

