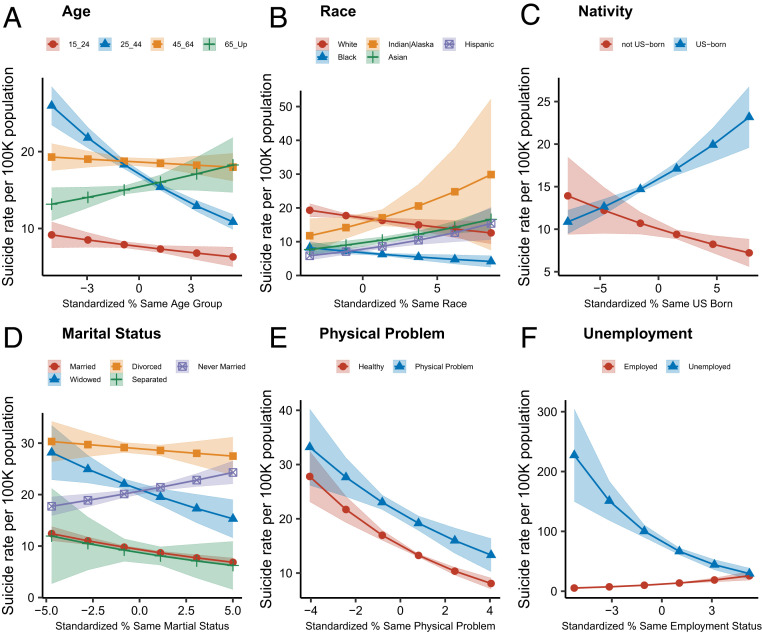
Fig. 3.
Cross-level interaction effects of social similarity at the county level. Note. We predict the suicide rate per 100,000 population across different subgroups (A: Age, B: Race, C: Nativity, D: Marital status, E: Physical problem; F: Employment status) across the range of social similarity at county levels. We employ multiple imputation logistic models (M = 10) for unemployment and physical problems to account for missingness; otherwise, we use logistic regression models (SI Appendix, Table S6).

