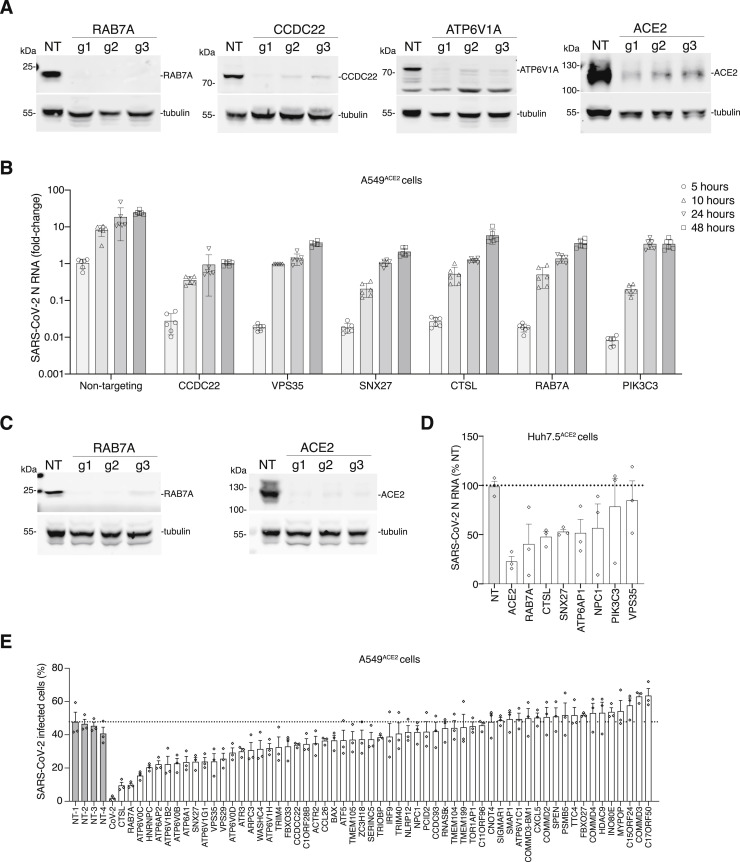
Figure S3.
Validation of Top-Ranked Genes Using CRISPR Perturbations and RNA Interference, Related to Figure 4
(A) western blot analysis of RAB7A, CCDC22, ATP6V1A, and ACE2 after transduction of A549ACE2 with the indicated CRISPR guide RNA and selection with puromycin for 7 days. For validation, we designed 3 independent guide RNAs per gene (i.e., distinct guide RNAs from those in the GeCKOv2 library). Beta tubulin was used as loading control. (B) Quantitative PCR (qPCR) of SARS-CoV-2 viral load present in A549ACE2 CRISPR-perturbed cells infected with SARS-CoV-2 at MOI of 0.1. The qPCR was performed on cells collected at the indicated time (hours) post-infection (hpi) (n = 6 biological replicates, error bars indicate s.e.m.). (C) western blot analysis of RAB7A and ACE2 after transduction of Huh7.5ACE2 with the indicated CRISPR guide RNA and selection with puromycin for 7 days. For validation, we designed 3 independent guide RNAs per gene (i.e., distinct guide RNAs from those in the GeCKOv2 library). Beta tubulin was used as loading control. (D) qPCR of SARS-CoV-2 viral load present in Huh7.5ACE2 CRISPR-perturbed cells infected with SARS-CoV-2 at MOI of 0.1. The qPCR was performed on cells collected and fixed at 36 h.p.i (n = 3 guide RNAs with 6 biological replicates each, error bars indicate s.e.m.). (E) Immunofluorescence quantification of SARS-CoV-2 N protein at 36 hours post-infection (hpi) at MOI 0.1 in A549ACE2 cells pretreated with siRNA pools for 48 hours (n = 3 technical replicates, error bars represent s.e.m., NT indicates non-targeting controls).

