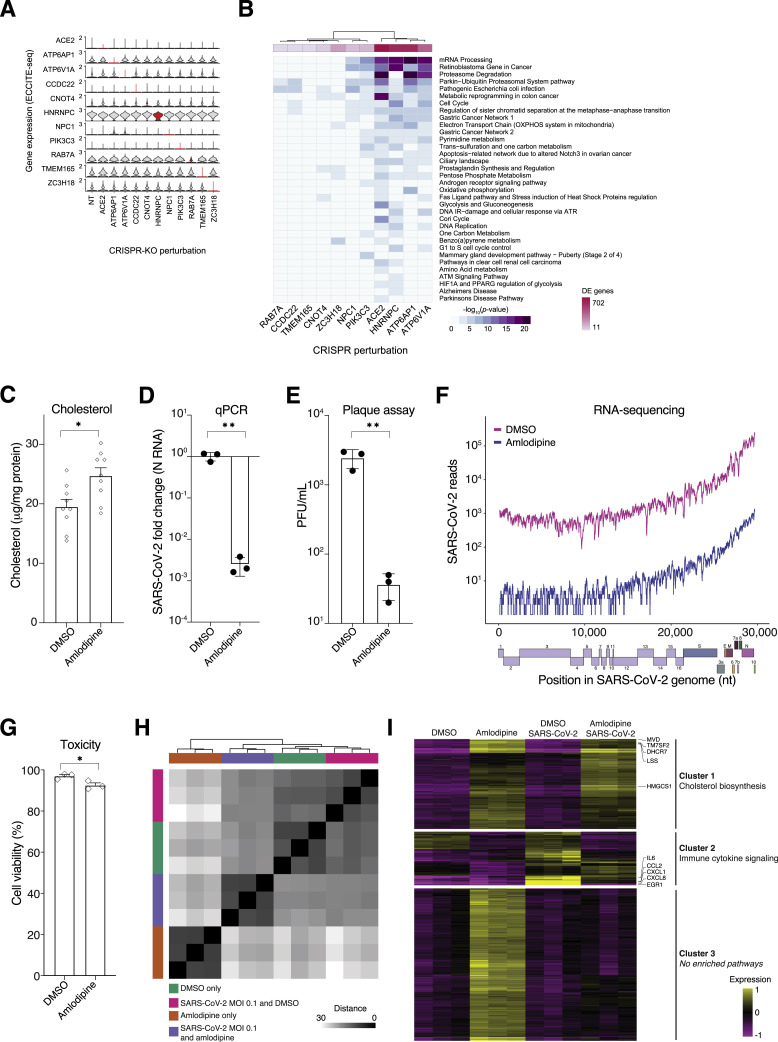
Figure S5.
ECCITE-Seq Identifies Cholesterol Gene Signature Shared across Multiple Top-Ranked Genes, Related to Figure 5
(A) Stacked violin plot of 11 genes shared in both ECCITE-seq experiments. Single-cells are grouped by unique guide RNA target gene label of cells with a single detected guide RNA. Target gene expression is highlighted in red. (B) Heatmap of Gene Set Enrichment Analysis results for genes downregulated in any of the indicated target gene perturbed cells. (C) Cholesterol (normalized by total protein) in A549ACE2 cells treated with amlodipine or vehicle (DMSO) for 24 hours. (D) Quantitative PCR (qPCR) of SARS-CoV-2 viral load present in A549ACE2 cells treated with amlodipine or DMSO for 24 hours and then infected with SARS-CoV-2 at MOI of 0.1. The qPCR was performed on cells collected at the indicated time (hours) post-infection (hpi) (n = 3 biological replicates, error bars indicate s.e.m.). (E) Plaque assays of SARS-CoV-2 viral load present in A549ACE2 cells treated with amlodipine or DMSO for 24 hours and then infected with SARS-CoV-2 using logarithmically diluted supernatants. (n = 3 biological replicates, error bars indicate s.e.m.). (F) Number of reads mapping to the indicated portion of the viral genome in A549ACE2 cells treated with amlodipine or DMSO. A representative sample is shown for each treatment (n = 3 biological replicate sequencing libraries). (G) Cell viability by Trypan Blue exclusion in A549ACE2 cells treated with amlodipine or DMSO for 24 hours (n = 3 biological replicates, error bars indicate s.e.m.). (H) Distance matrix of RNA-sequencing from A549ACE2 cells treated with amlodipine or DMSO for 24 hours and then infected at MOI 0.1 or mock infection (n = 3 biological replicate sequencing libraries for each treatment-infection group). Read counts were processed with the DESeq2 regularized-log transform before computing distances. (I) k-means clustering (k = 3) of the top 500 most variable genes across all 4 conditions (n = 3 biological replicate sequencing libraries for each treatment-infection group). For each cluster, we label the most enriched pathway (lowest p-value) and, for the genes in that pathway, we label the top 5 most variable genes. No significantly enriched pathways were found for Cluster 3.

