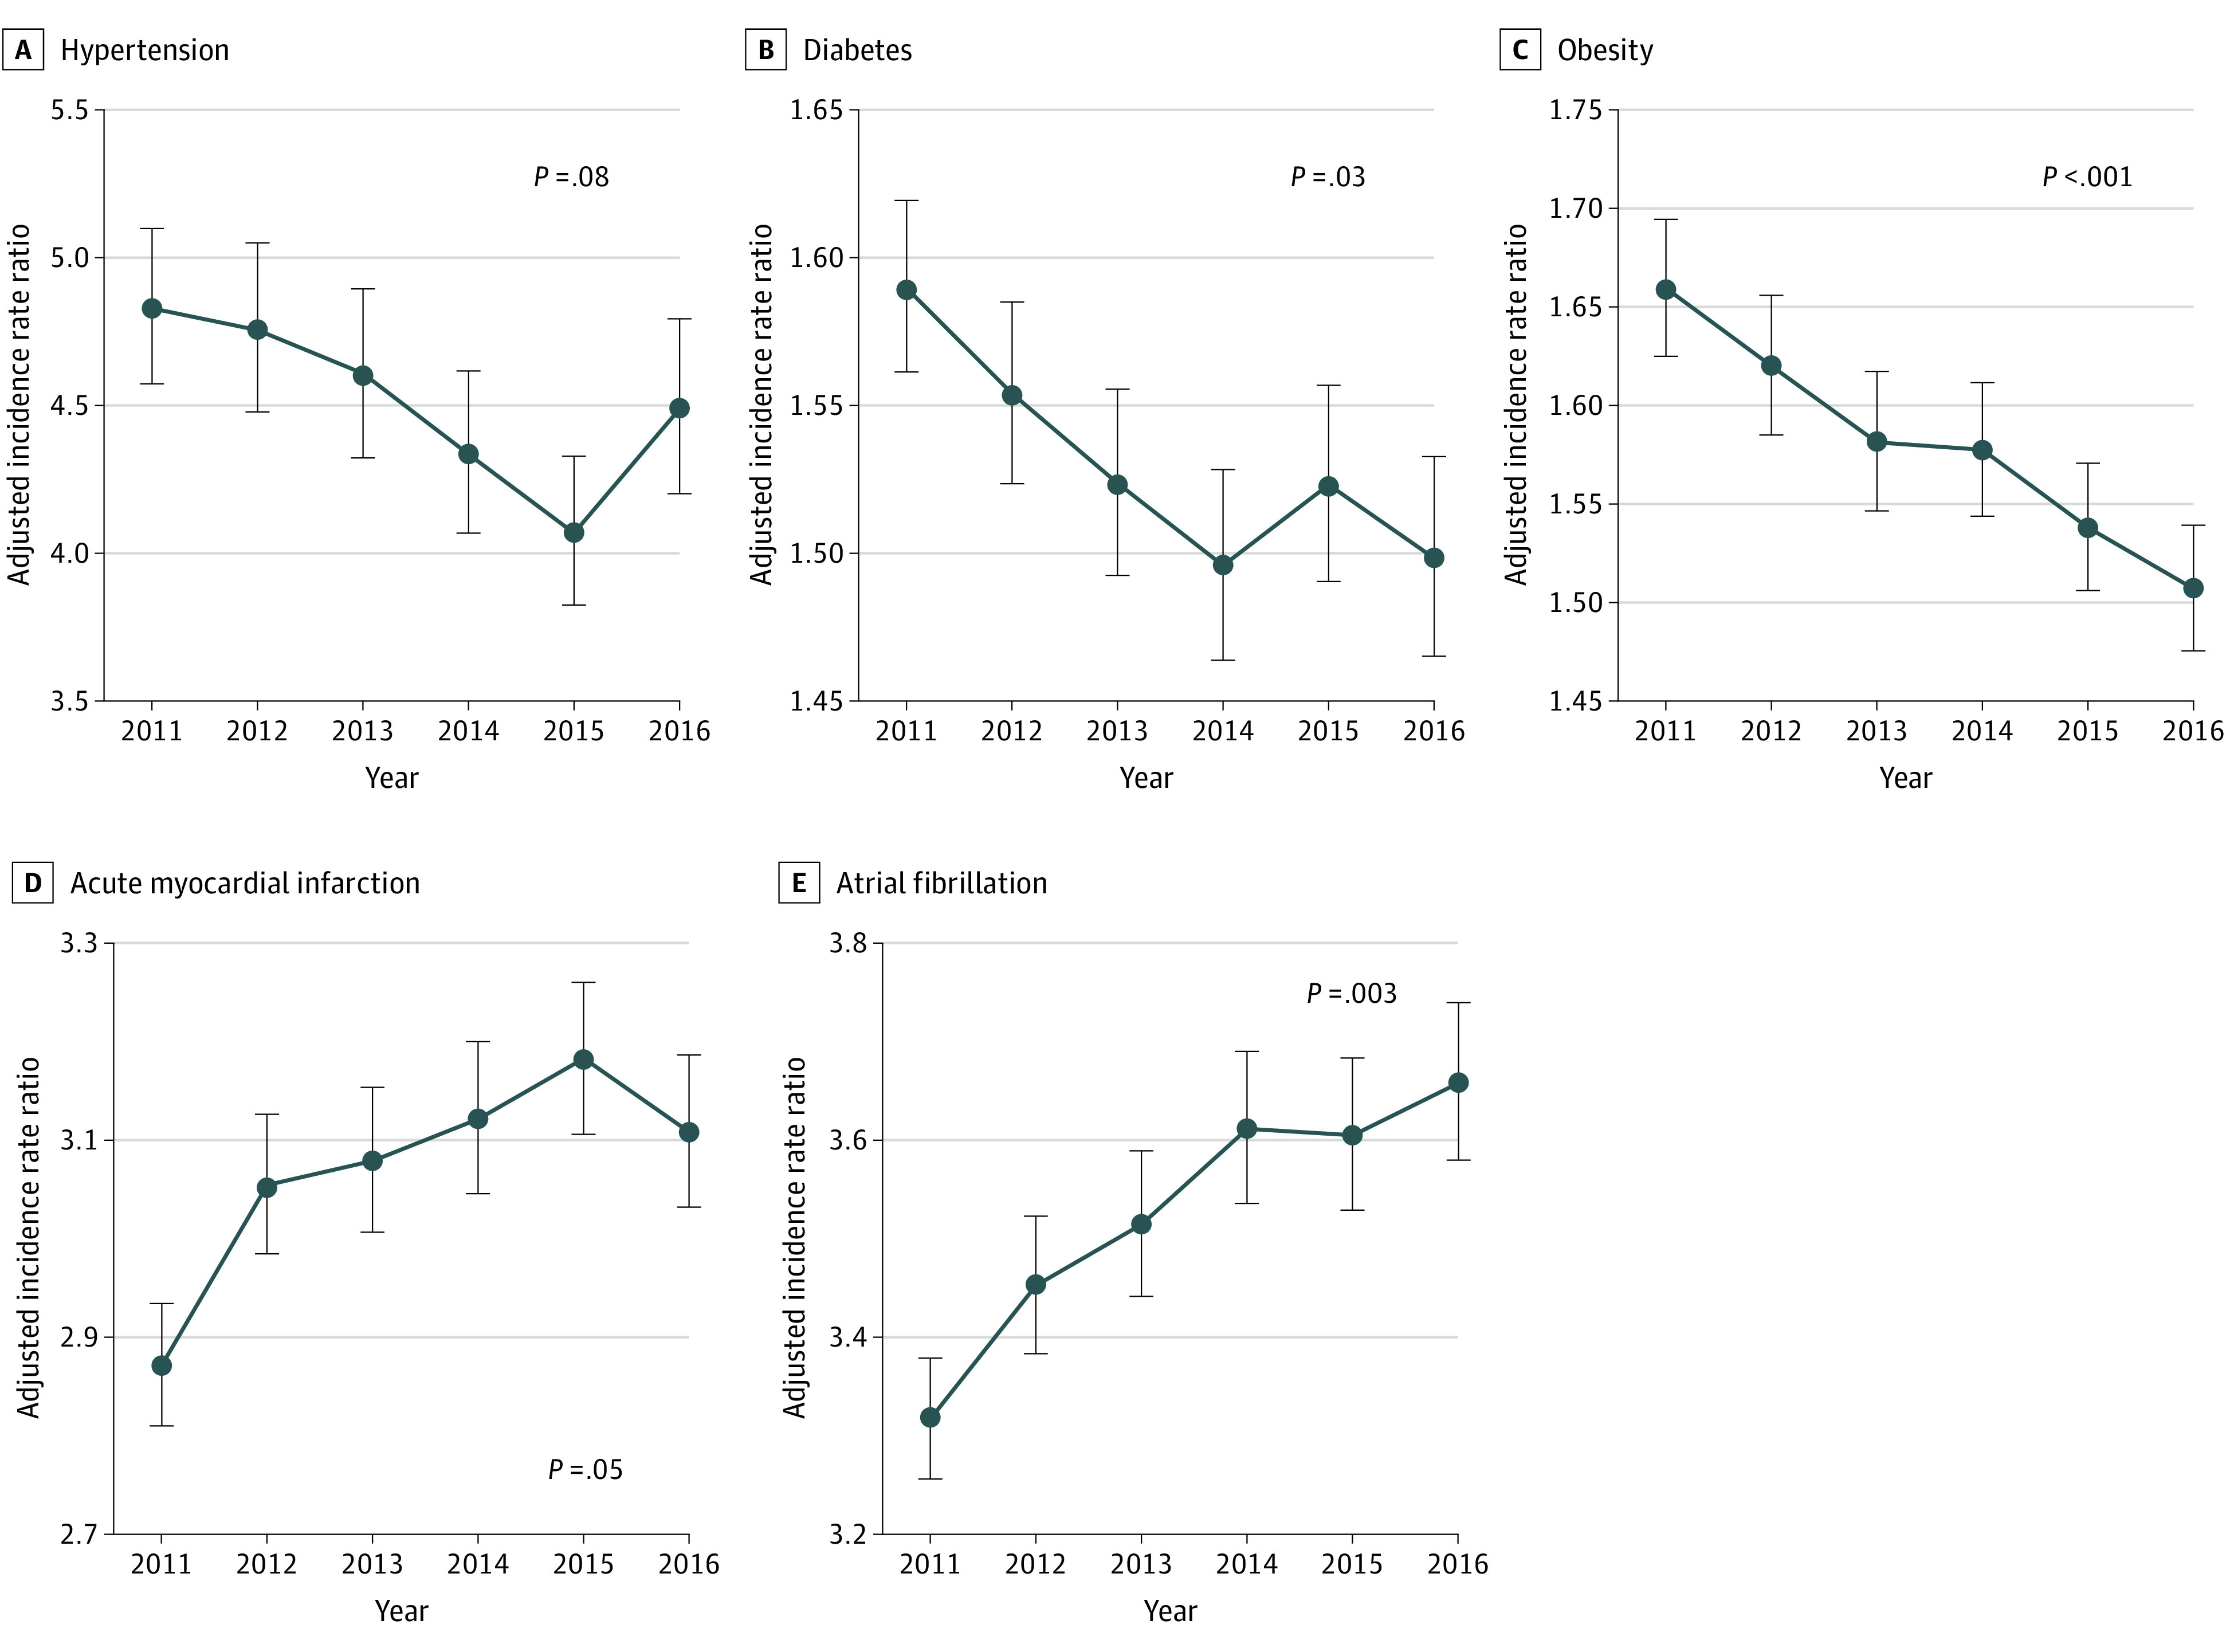
Figure 3. Adjusted Incidence Rate Ratios for Heart Failure Among Medicare Beneficiaries With vs Without Each Risk Factor Over Time, 2011 to 2016.

A-E, Poisson regression models were constructed to assess the association of each risk factor with heart failure incidence for each year, with adjustment for age, sex, race/ethnicity, socioeconomic status, and all 5 risk factors. P values reflect trends in the incidence rate ratio over time. Error bars indicate 95% CIs.
