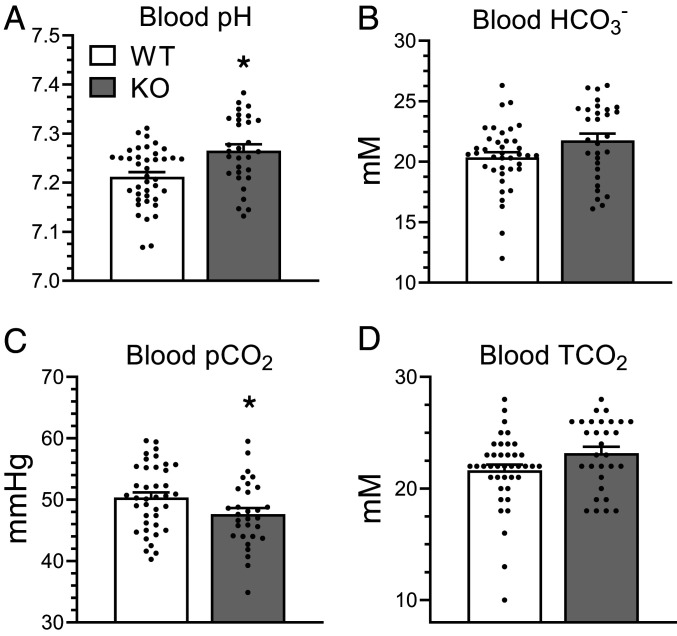
Fig. 6.
Kidney-specific Gpr116 KO mice have alkaline blood and reduced pCO2 compared to WT littermates. (A–D) Whole-blood samples harvested from facial vein puncture demonstrate increased blood pH from KO mice, a trend toward increased blood HCO3−, and significantly reduced pCO2. TCO2 is not statistically different, but shows a trend toward increased values in KO samples (due to increased HCO3− in those samples). TCO2 was calculated as the sum of pCO2 (in mM) and HCO3−. Bars are mean ± SEM. n = 39 WT mice, 30 KO mice. Statistical analysis performed using Mann–Whitney test. *P < 0.05. Blood pH: WT vs. KO *P = 0.002; blood HCO3−: WT vs. KO P = 0.06; pCO2: WT vs. KO *P = 0.04. TCO2: WT vs. KO P = 0.06.

