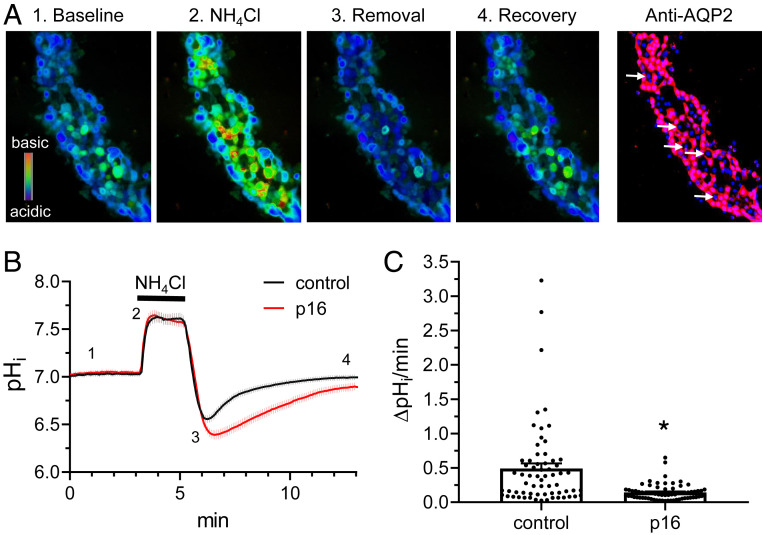
Fig. 10.
Gpr116 activation in A-ICs inhibits pHi recovery. (A) Representative pseudocolor images (blue, acidic; red, alkali) of intracellular pH in a split opened collecting duct loaded with pH-sensitive dye BCECF at the baseline (1), upon application of 40 mM NH4Cl (2), immediately after NH4Cl removal (3), and recovery toward the baseline pHi values (4). Confocal micrograph of the same split-opened CD probed with anti-AQP2 (pseudocolor red) is shown on the right. Examples of AQP2− ICs are depicted with white arrows. Nuclear DAPI staining is shown in pseudocolor blue. Magnification: 40×. (B) Summary graph comparing the time course of pHi changes in control (black) and p16 pretreated (100 µM for 40 min, red) ICs. Trace shows mean ± SEM for 65 control cells and 69 p16-treated cells. Each experimental condition is a summary from four collecting ducts from four different mice. Application of the NH4Cl pulse is designated by the black bar above the trace. The time points shown in A are marked as 1 to 4. (C) Summary graph of H+ extrusion rate from ICs from the control and after pretreatment with p16 shown in B. The rate was calculated as a linear slope of pHi recovery after 40 mM NH4Cl application. Statistical analysis performed using Mann–Whitney test. *P < 0.05. Control vs. p16 *P < 0.0001.

