Fig. 3.
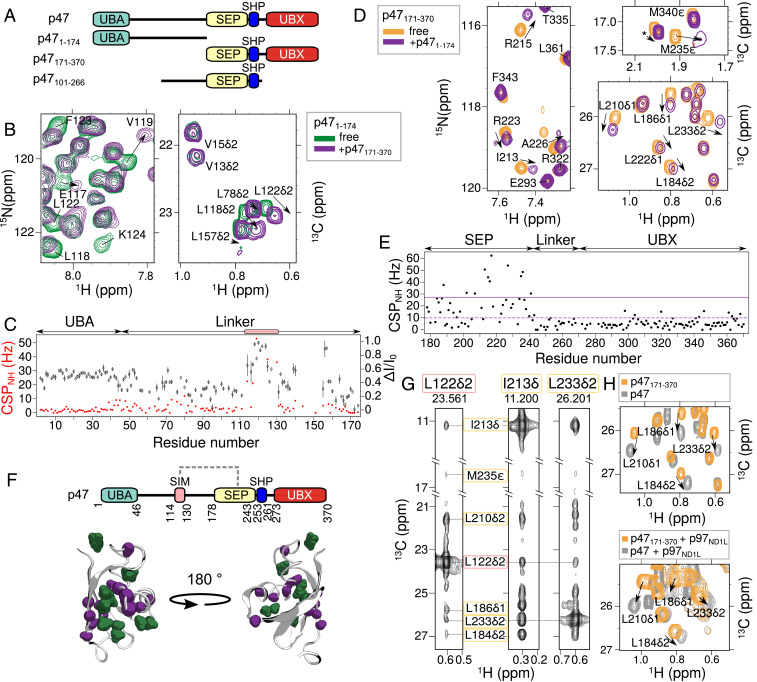
The unstructured linker of p47 interacts with the SEP domain. (A) Domain architecture of p47 constructs used in studies illustrated in this figure. (B) Selected regions of 15N-1H HSQC (Left) and 13C-1H constant time (CT)-HSQC (Right) spectra of [U-13C,15N]p471–174 showing perturbations (chemical shift changes and line broadening) upon addition of threefold excess unlabeled p47171–370. (C) CSPs (red spheres) and changes in intensities (black diamond), quantified as ΔI/I0 = (I0 − I)/I0, where I is the intensity of a resonance in the 15N-1H HSQC spectrum of p471–174 upon addition of p47171–370, and I0 is the corresponding intensity in the absence of added ligand. Peaks derived from a continuous set of residues, S114 to G130, show perturbations and are highlighted by the pink box. (D) Selected regions of 15N-1H HSQC (Left) and 13C-1H CT-HSQC (Right) spectra of [U-13C,15N]p47171–370 upon addition of threefold excess unlabeled p471–174. (E) CSPs from 15N-1H HSQC spectra of p47171–370 resulting from the addition of p471–174. Average CSP value and CSP 1σ above average are indicated with dashed and solid lines, respectively. (F, Top) Domain architecture of p47 depicting interaction between the SEP domain and a SIM on the linker (dashed gray line). (F, Bottom) Cartoon representation of the SEP domain (PDB ID code 1VAZ; ref. 38). Residues with CSPs 1σ above the average in the 15N-1H HSQC and 13C-1H CT-HSQC spectra are colored purple and green, respectively. (G) NOEs connecting L122δ2 located in the SIM sequence (pink box) and methyl groups of residues in the SEP domain (yellow box). The NOE dataset was recorded using a [U-2H,ILVM-13CH3]p47101–266 sample at 18.8 T (25 °C). (H) Overlay of 13C-1H HMQC spectra of [U-2H,ILVM-13CH3]p47171–370 (orange) and [U-2H,ILVM-13CH3]-labeled full-length p47 (gray) in the absence (25 °C) (Top) or presence (40 °C) (Bottom) of [U-2H]p97ND1L added to a molar ratio of [p47]([p47171–370]):[p97ND1L] of 3:6 (monomer:monomer). Data were recorded at 18.8 T.

