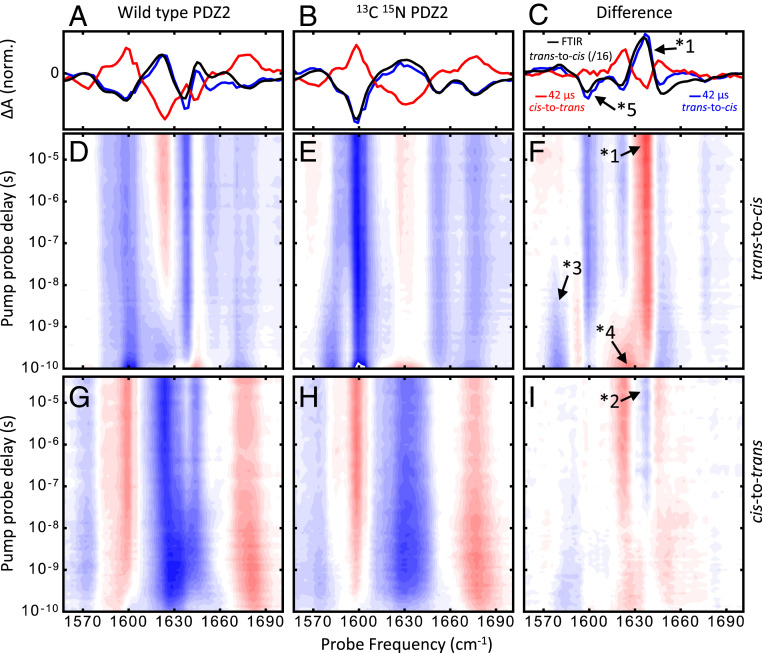
Fig. 2.
Transient IR spectra of PDZ2 in the region of the amide I band. A–C compare transient data at long pump–probe delay times (averaged from 20 μs to 42 μs to increase signal-to-noise) for trans-to-cis (blue) and cis-to-trans (red) switching, together with a properly scaled trans-to-cis FTIR difference spectrum (black). D–F show the complete transient data for trans-to-cis switching and G–I show that for cis-to-trans switching. The left graphs show the data for the WT protein, middle graphs show that for the sample with the protein N-labeled (the peptide ligand contains naturally abundant N), and right graphs show the N-WT difference data. Red colors in D–I indicate positive-absorbance changes, and blue colors indicate negative-absorbance changes. The relative scaling of the datasets and the labeled features are discussed in Experimental.

