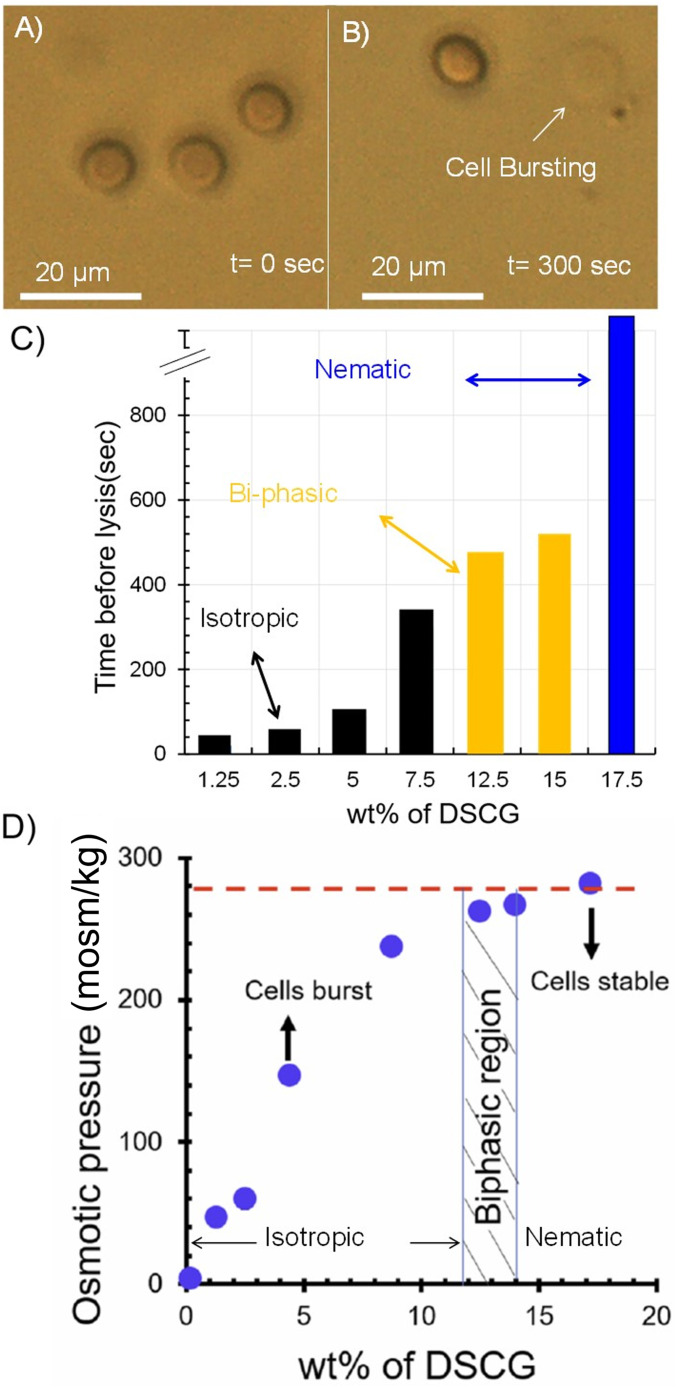
Fig. 2.
(A and B) RBCs imaged (optically) immediately (A) and 300 s (B) after transfer to an isotropic, aqueous DSCG solution (154 mM). The RBCs sedimented onto a glass substrate and thus the disk shapes observed in A are projections of a biconcave cell shape. (C) Time for lysis of RBCs suspended in aqueous DSCG solutions plotted as a function of the concentration of DSCG. The black, yellow, and blue colors indicate, respectively, isotropic, biphasic, and nematic phases of DSCG. (D) Osmotic pressure (measured using vapor pressure osmometry) of aqueous DSCG solutions at 25 °C.

