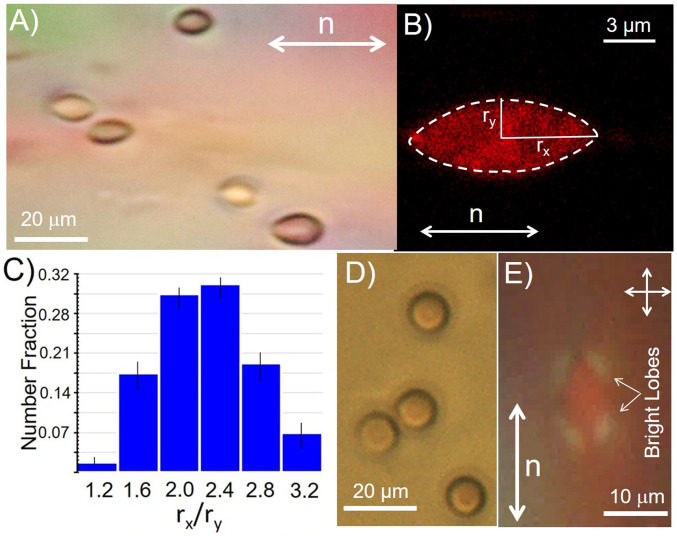
Fig. 3.
(A) Optical micrograph of strained RBCs suspended in a nematic LC phase (17.3 wt % DSCG aqueous solution) at 25 °C. The far-field director of the LC is shown by the white arrow. (B) Confocal micrograph of a strained RBC dispersed in the nematic LC phase described in A. (C) Histogram showing the variation in values of rx/ry for 120 RBCs strained by a nematic LC phase. (D) Optical micrograph of sample in A following heating of the nematic DSCG phase into an isotropic phase (39 °C). (E) Optical micrograph (crossed polarizers) showing nematic DSCG strained around a RBC.

