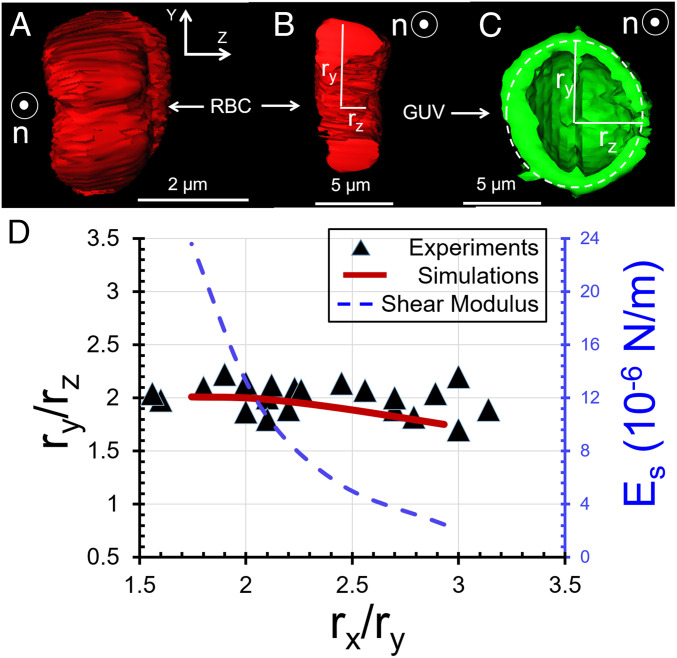
Fig. 4.
(A) End-on view (looking along the LC director) of the 3D shape of a LC-strained RBC obtained using confocal microscopy. The LC was aqueous 17.3 wt % DSCG at 25 °C. (B) y-z cross-section of the strained RBC described in A. (C) y-z cross-section of a GUV strained by the nematic LC described in A. (D) Values of ry/rz plotted as a function of rx/ry (experimental measurements as symbols, simulation results as a solid curve) for RBCs dispersed in the LC described in A. Calculated shear moduli are also plotted as a function of rx/ry on the right-side ordinate (dashed curve).

