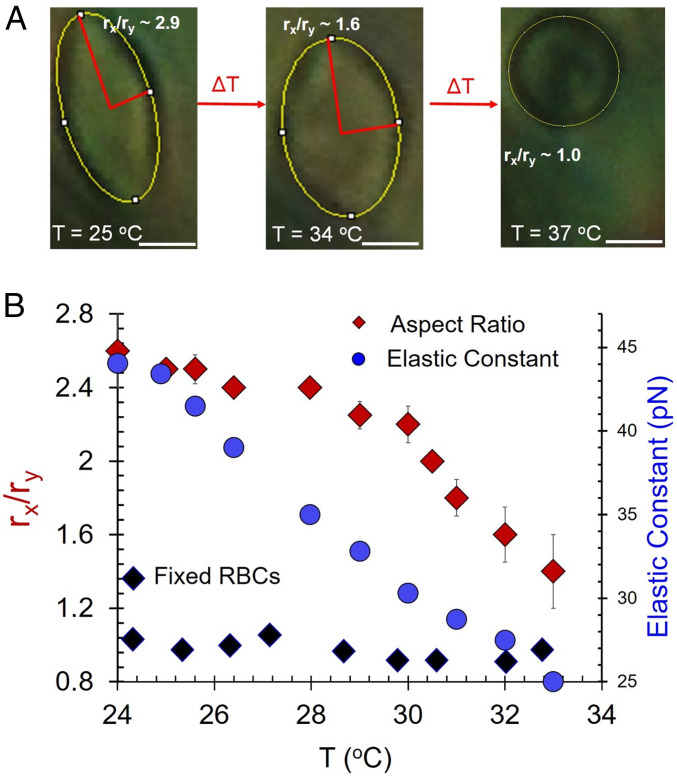
Fig. 6.
(A) Optical micrographs showing the change in shape (characterized by rx/ry) of a RBC in aqueous 17.3% DSCG as a function of temperature (scale bar, 4 µm.) (B) Plots of rx/ry of healthy and glutaraldehyde-treated RBCs plotted as a function of temperature for RBCs dispersed in 17.3% DSCG. The variation in K3 of the DSCG phase (blue dots show data from ref. 18; see text for details) with temperature is shown in the same plot. Black diamonds are RBCs that were cross-linked with glutaraldehyde prior to dispersing in LC.

