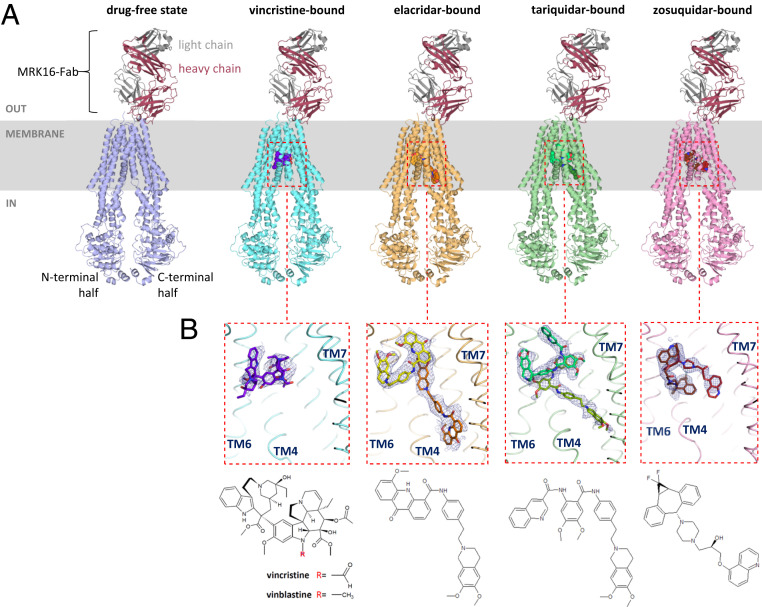
Fig. 2.
Overview of ABCB1–MRK16-Fab structures. (A) Ribbon diagrams of drug-free and drug-bound states of ABCB1–MRK16-Fab structures. The drug molecules are represented in sphere representation. (B) Close-up view of the binding pocket of vincristine- and inhibitor-bound structures, with adjacent TM helices shown as backbone splines and labeled. The thresholds of the EM density maps were adjusted such that the level of density covering the surrounding TM helices is comparable. Drug molecules are shown as sticks and their corresponding chemical structures are shown underneath.

