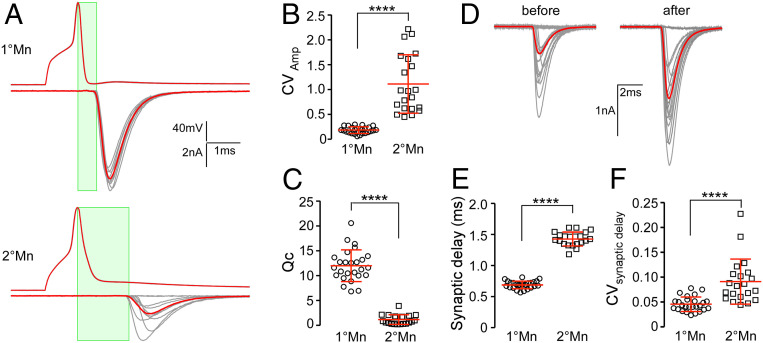
Fig. 3.
Functional distinctions between 1° and 2°Mn synapses. (A) Example traces of action potentials and EPCs (average in red) for CaP 1°Mn and 2°Mns in response to 10 stimuli at 1 Hz. The time window for synaptic delay measurement is shown (in green). (B) Scatterplot comparing the coefficient of variation (CV; mean ± SD in red) for EPC amplitudes between the 1° and 2°Mns. CV is calculated for 20 responses acquired at 1 Hz for each cell. (C) Scatterplot comparing quantal content (mean ± SD in red) between 1° and 2°Mns. (D) A sample 2°Mn paired recording showing 20 EPCs at 1-Hz stimulation before and after facilitation (average in red). The facilitation was induced with a 100-Hz, 2-s stimulus train in the 2°Mn. (E) Scatterplot comparing the synaptic delay (mean ± SD in red) between 1° and 2°Mns. (F) Scatterplot comparing CV (mean ± SD in red) for the synaptic delay between 1° and 2°Mns. ****P < 0.0001.

