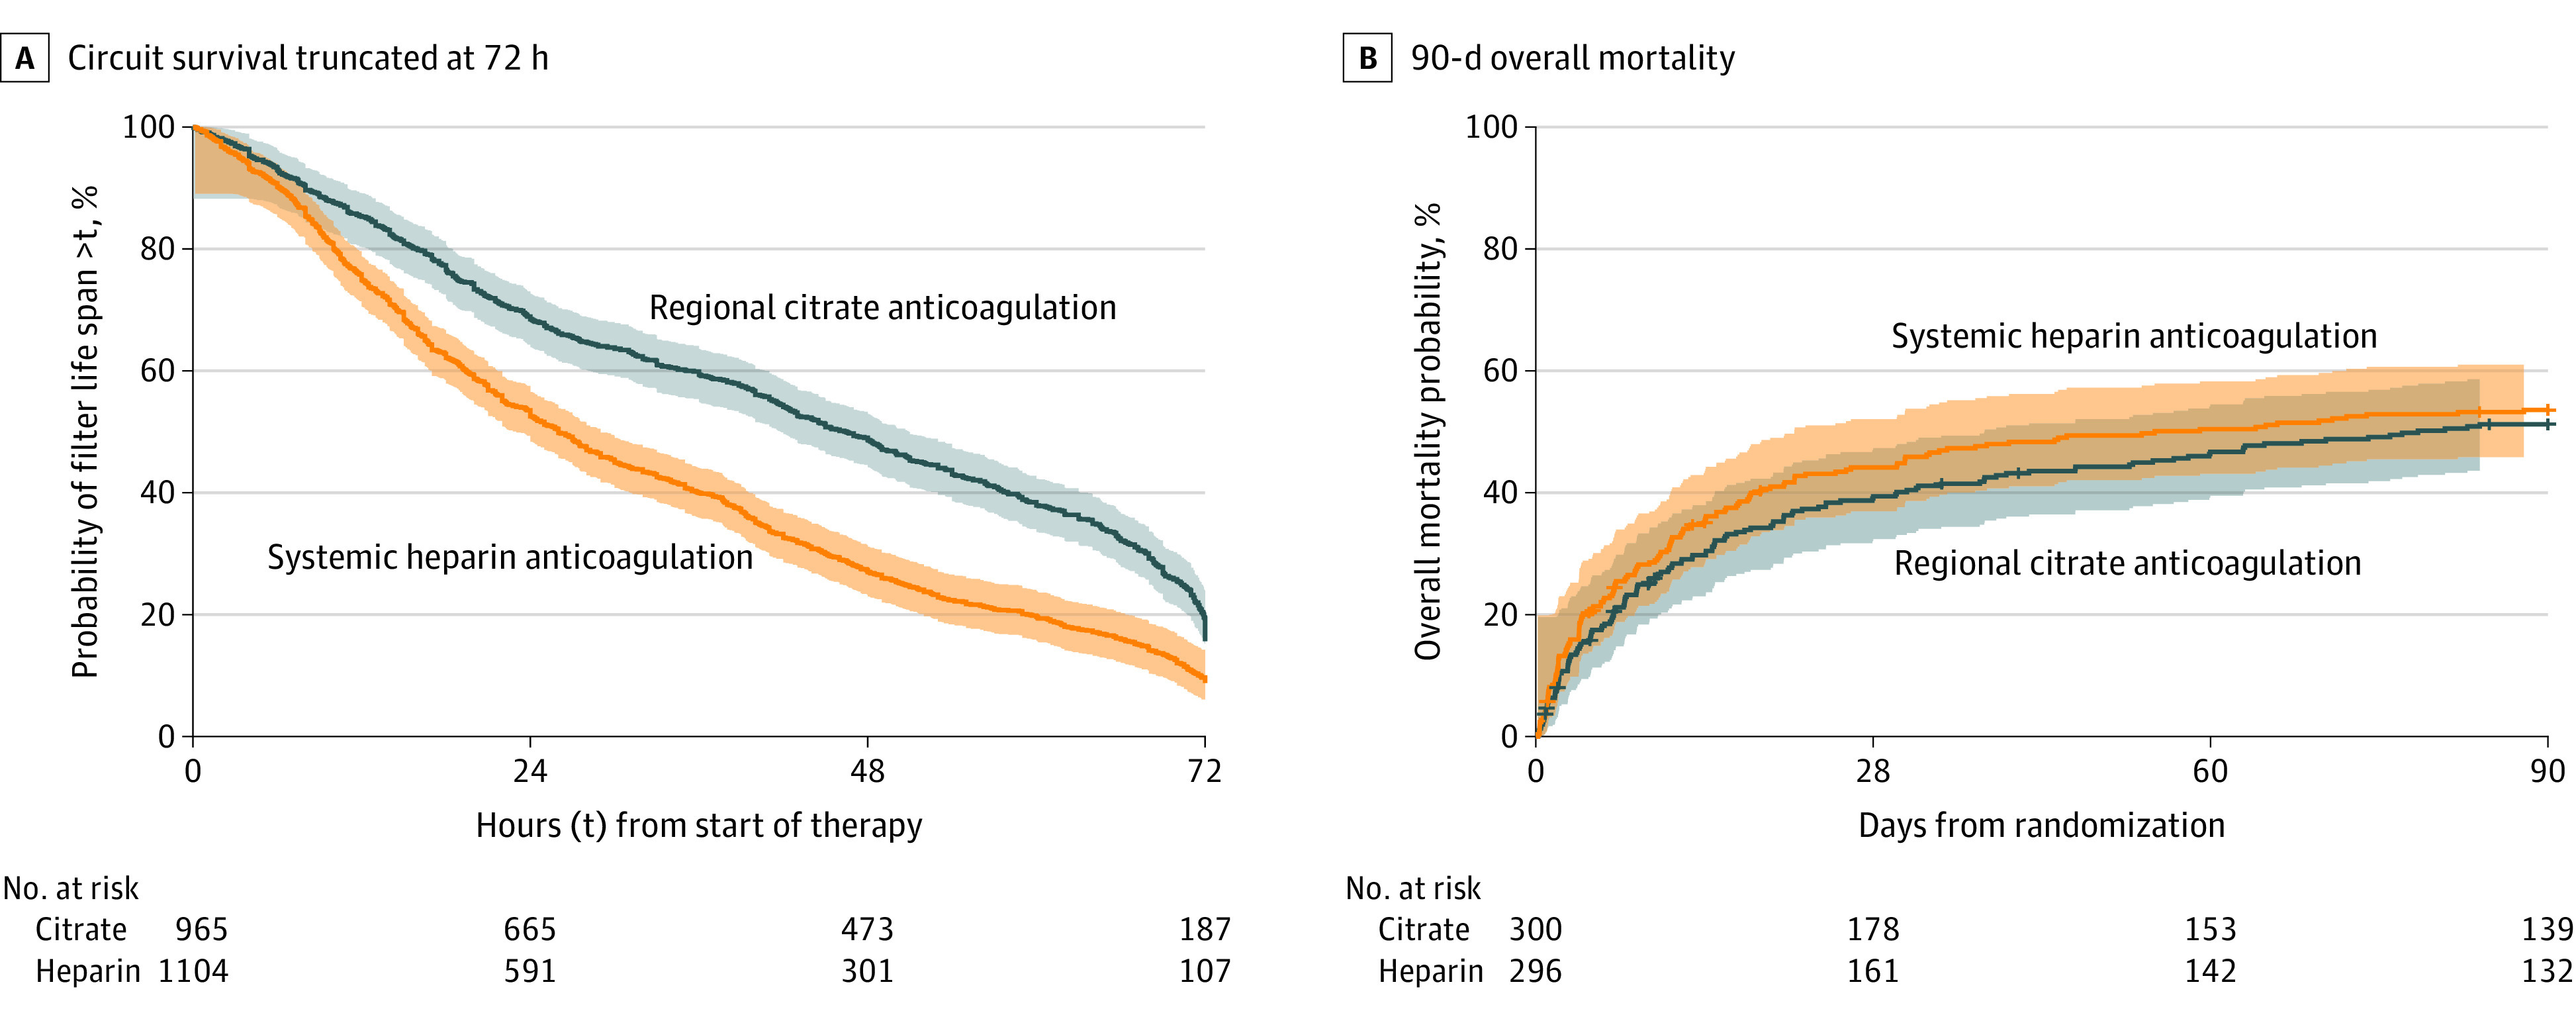
Figure 2. Kaplan-Meier Curves With Hall-Wellner Confidence Bands.

A, Time (hours) from start of kidney replacement therapy to filter replacement. All circuits were observed to failure or 72 hours. B, 90-day overall mortality, with median (interquartile range) observation time 90 days. Ticks perpendicular to curves indicate censored patients (n = 19).
