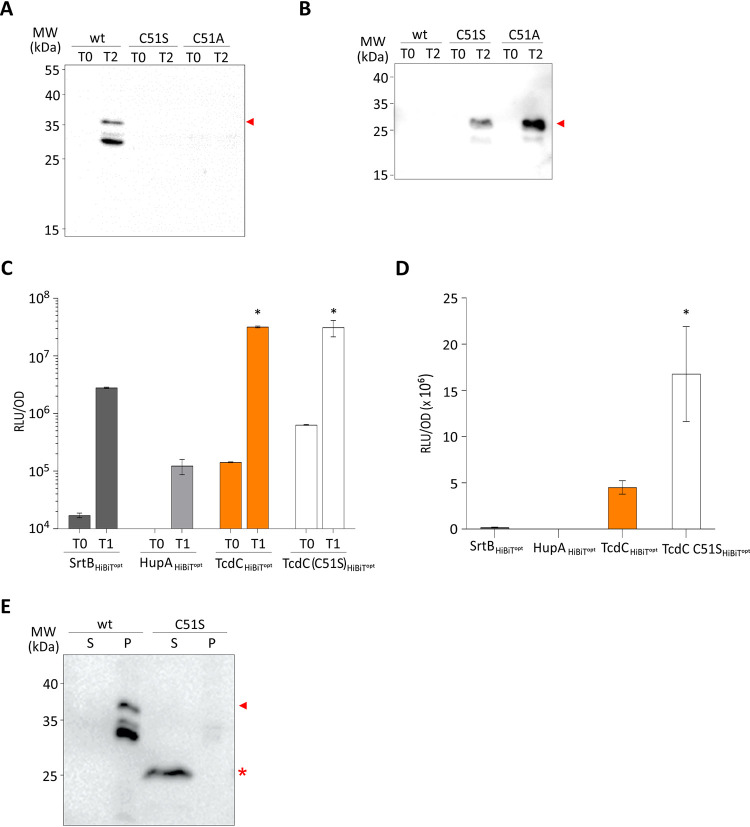
FIG 4.
TcdC C51S affects membrane localization. (A) Western blot analysis, with anti-TcdC, of C. difficile 630Δerm cell lysates harboring pLDJ1 (Ptet-tcdC-3×myc), pLDJ2 [Ptet-tcdC(C51S)-3×myc], and pJC129 [Ptet-tcdC(C51A)-3×myc] before (T0) and after (T2) induction with 200-ng/ml ATc for 2 h. TcdC is indicated with an arrowhead. (B) Western blot analysis, with anti-TcdC, of C. difficile 630Δerm culture supernatants harboring pLDJ1 (Ptet-tcdC-3×myc), pLDJ2 [Ptet-tcdC(C51S)-3×myc], and pJC129 [Ptet-tcdC(C51A)-3×myc] before (T0) and after (T2) induction with 200-ng/ml ATc for 2 h. The secreted/released TcdC is indicated with an arrowhead. (C) Proteins of interest were C-terminally fused to a HiBiT protein tag, and their expression was induced with 50-ng/ml ATc for 45 min. The optical density-normalized luciferase activity (RLU/OD) of the culture (cells plus medium) is shown right before induction (T0) and after 45 min of induction (T1). HiBiTopt-tagged sortase and HupA proteins were used as surface-exposed and intracellular controls, respectively. Luciferase activity with TcdC-HiBiTopt and TcdC(C51S)-HiBiTopt is also displayed. The averages for biological triplicate measurements are shown, with error bars indicating the standard deviation from the mean. *, P < 0.001 by two-way ANOVA. (D) Observed luciferase activity (RLU) in supernatants only from the cells for which the results are shown in panel C. (E) Comparison of cell-associated and cell-released TcdC. The same samples for which the results are shown in panels A and B were run next to each other for a fair comparison of the sizes of the proteins. Cell-associated TcdC is indicated with an arrowhead, and cell-released TcdC is indicated with an asterisk. wt, wild type; S, supernatant; P, pellet.

