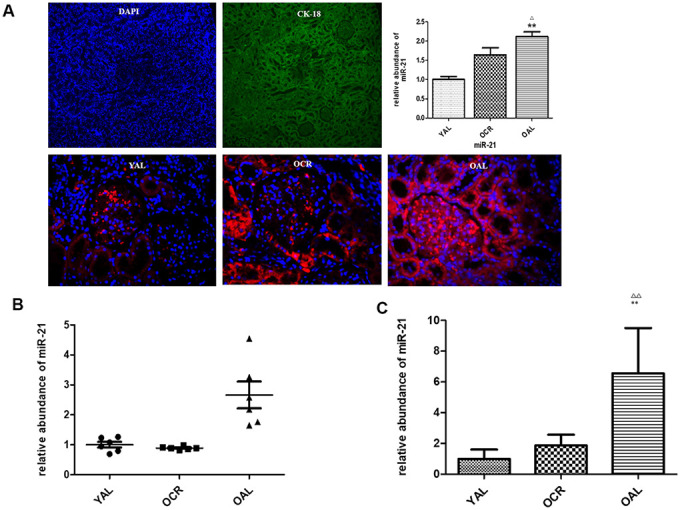
Figure 4.

miR-21 expression in rat kidney tissue detected by FISH and qPCR. (A) The tubular epithelial cells were marked by DAPI and Cytokeratin 18 (CK-18);In situ hybridization of miR-21 in renal biopsies of rats in YAL and OAL; Quantification of in situ hybridization results. **P<0.01. (B) Comparison of miR-21 level in tissues. Black triangles indicated the irrelative miR-21 abundance. The black lines represented the means of miR-21 abundance. Statistical significance was present between OAL, YAL and OCR groups. (C) Comparison of miR-21 level in urine EVs. qRT-PCR analyses of miR-21 by relative quantification respectively. ** p < 0.01 (YAL vs OAL); ΔΔp < 0.01 (OCR vs OAL).
