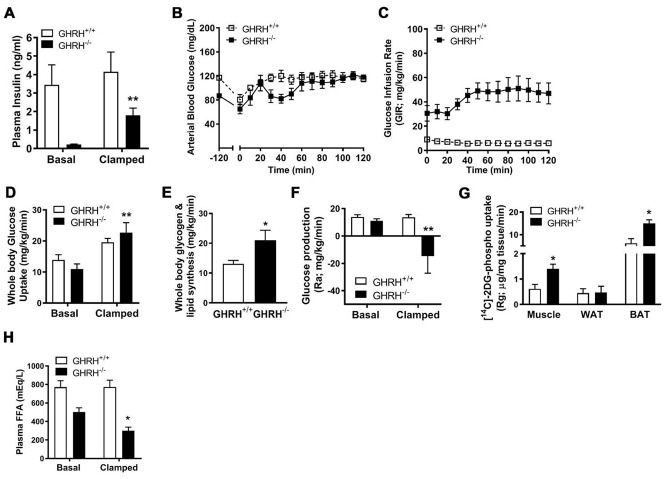
Figure 2.
Various metabolic parameters during hyperinsulinemic-euglycemic clamp of GHRH-/- mice. (A) Plasma insulin. (B) Blood glucose. (C) Glucose infusion rate. (D) Whole body glucose uptake. (E) Whole body glycogen and lipid synthesis. (F) Repression of rate of endogenous glucose production. (G) [14C] 2DG uptake into gastrocnemius, epididymal white and brown adipose tissue. (H) Plasma free fatty acids. All data were represented as mean ± sem (n = 4-5 mice for each genotype). Statistical analysis was performed by unpaired Student’s t-test, * P < 0.05 and ** P < 0.01 versus baseline time point (D) or versus vehicle within time points (A and E–H).

